Every sales team argues about whether reps discount too much. In one of my NetSuite test accounts, the answer turned out to be the opposite. On multi-unit wholesale lines, reps had been quoting above the quantity-break prices customers were entitled to, and there was churn to show for it. Nobody was looking for that, because nobody thinks under-discounting is a thing.
This is the second post on the revenue and customer prompts in the Sonar AI Prompt Library. Part one covered the August 9 release: sales maps, win and loss analytics, discount leakage, segment mix, and customer risk. This one covers four prompts from the August 24 release that answer four questions: where do we make money, how should we price, do customers pay the way they promised, and are the acquisitions working.
If you're new to this, Sonar AI is an AI agent that runs inside NetSuite. Every prompt in the library is a playbook that I engineered and tested against live NetSuite data, and you run it inside your own account, against your own records.
Where the Money Is Made
The Revenue Treemap Builder is one of the free prompts. One glance answers a question every operator asks: where do we actually make money, and where do we just move volume? It builds an interactive category-to-item treemap straight from the posted general ledger. Tile size is revenue, or gross profit, or units. Color is margin percentage, or year-over-year growth. Click a category to drill into its items, and click an item to open its record in NetSuite. There's a KPI header, a sparkline per category, outlier isolation, and search highlighting.
In the test account, the trailing twelve months came to $1.24M of revenue across five categories and 92 items, up 42 percent on the prior year. Home and decor was the largest tile and apparel the second. The point of the treemap is that high-revenue items and high-margin items are rarely the same items, and this is the fastest way I know to see which is which.
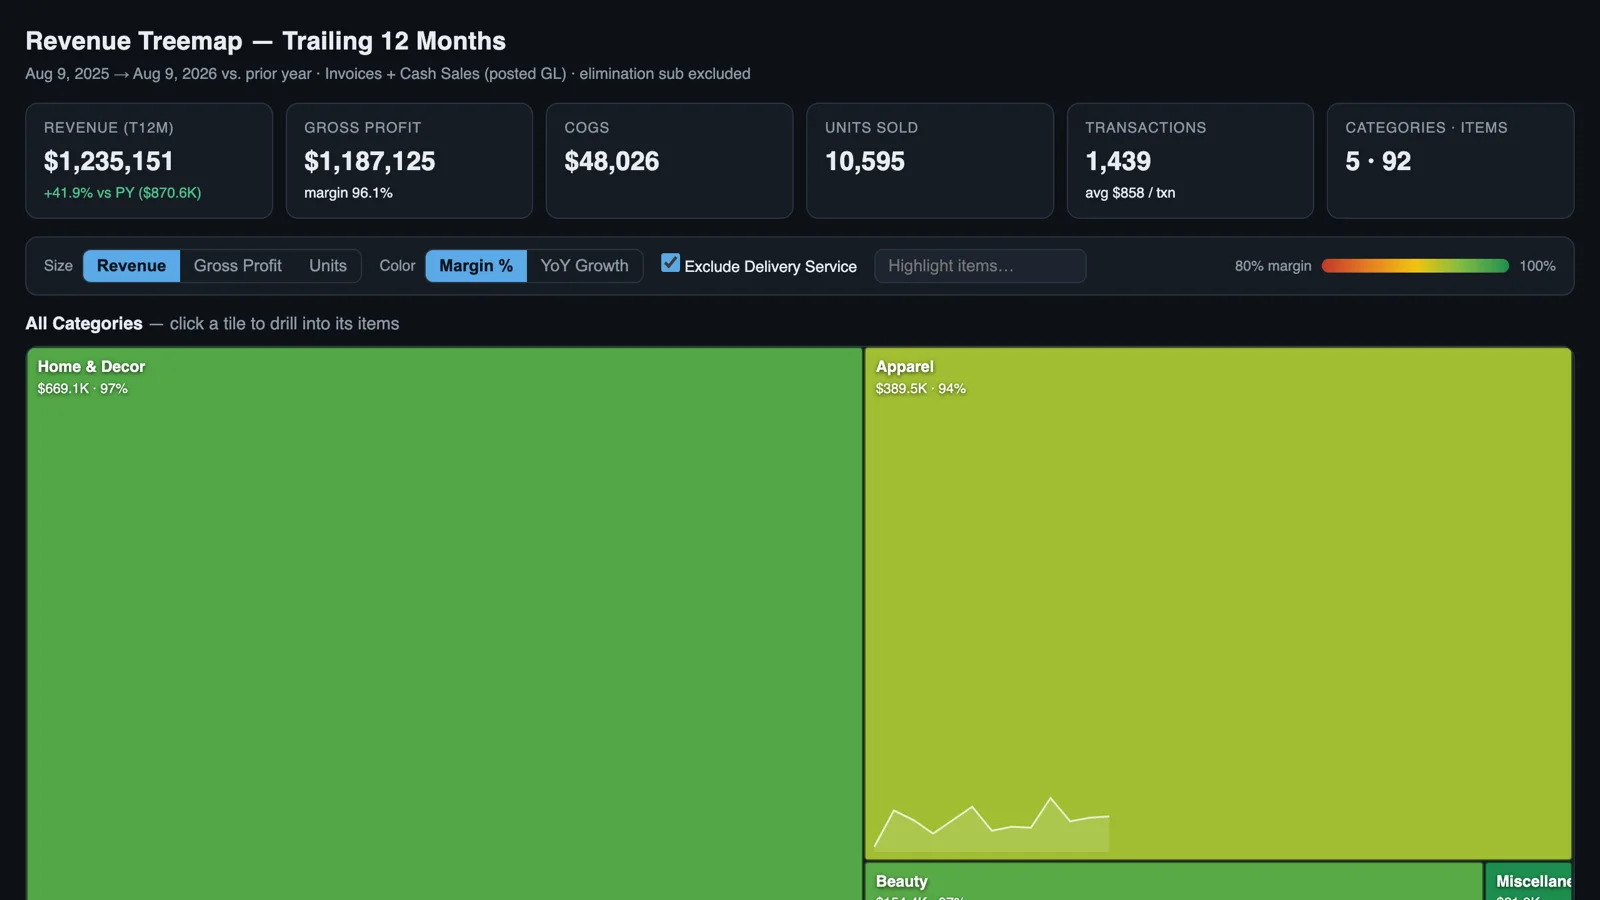
Sample report: Revenue Treemap: Trailing 12 Months.
Pricing Power, in Both Directions
Pricing Experiments: Elasticity by Segment and Quote-by-Quote Rep Guidance mines your own order history for the natural price variation buried in it, which is realized line rates against the quantity-break price book. From that it estimates price elasticity per customer segment, audits discount discipline in both directions, and derives floor, target, and stretch guidance per item and segment. The method is a within-item log-log regression with shrinkage to keep small samples from producing wild estimates, and a Lerner-rule optimization on top. The report ends with a staged experiment plan, because the right move after estimating elasticity is to test it before the price book moves.
The test account gave it 6,942 priced order lines over two years, and the headline wasn't over-discounting. B2C elasticity came out at -2.95, tight enough to act on. Eighty-two percent of multi-unit wholesale lines were priced above the quantity-break tier the customer was entitled to, adding up to $46.9K of overcharge over 24 months. The report's first recommendation was to enforce quantity-break entitlement on every wholesale quote immediately, and it was careful to call that a discipline fix rather than a price cut. Its second was controlled markdown tests on 53 B2C items where the elasticity said lower prices would earn more profit, with a projected lift of about $19.5K a year. And its third was the one I found most interesting: inject deliberate price variation into the manufacturing segment, where two years of flat pricing had made demand response unmeasurable.
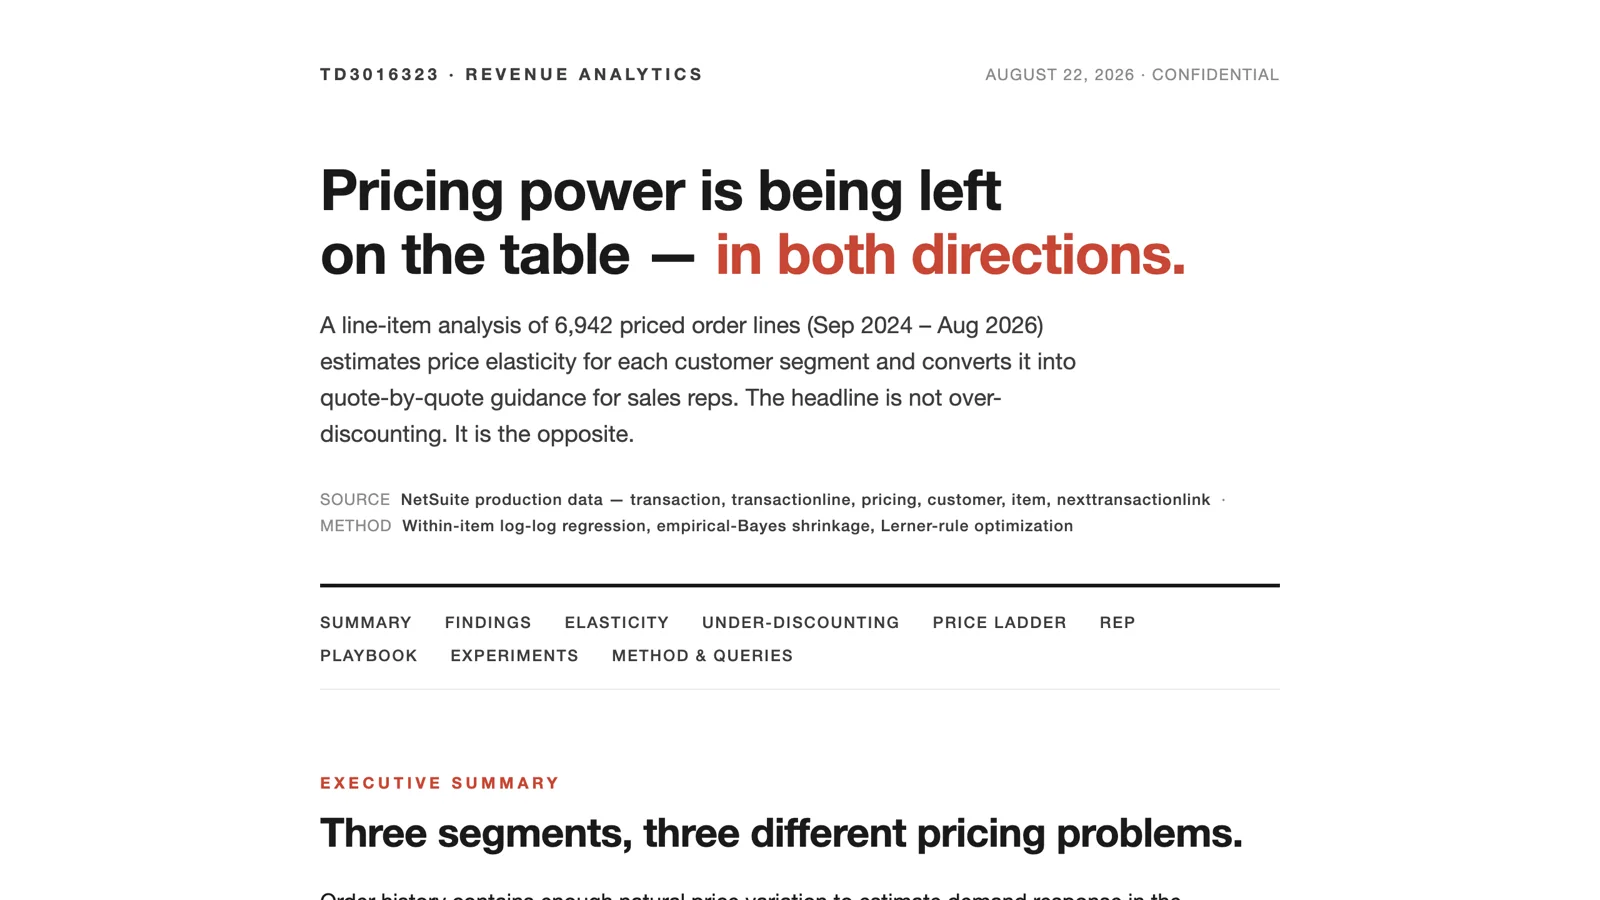
Sample report: Pricing Power: Elasticity & Quote Guidance.
Terms Are a Promise, History Is the Truth
Your customers' payment terms are a promise. Their payment history is the truth. The Terms vs. Behavior Audit measures the gap between the two, at the payment-application level, dollar-weighted, across the full history. That grain matters. Each application of a payment to an invoice is one observation, weighted by the dollars applied, which handles partial payments correctly and avoids letting the last payment define the invoice.
It surfaces who actually pays late, which is usually fewer than you think. Who pays early, which is free float you're receiving without offering a discount. Customers whose large invoices settle slower than their small ones, which the report treats as the earliest warning sign of a collections problem. And the anomalies most teams never see: payments dated before their invoices, trend breaks in portfolio behavior, and dispute signatures hiding in "slow payer" data.
The test account had 1,472 payment applications worth $3.65M. On paper the book was in excellent shape: 96 percent paid within terms, and only five of 49 net-30 customers averaged past 30 days, with the worst at three days over. The findings were in the exceptions. Payment behavior had deteriorated sharply in June 2026, from a three-to-five-day average to about eighteen, and had stayed there. Six payments were dated before their invoices, including invoices dated two weeks in the future. One customer with $195K of invoices had no payment terms on its record at all, so every aging bucket treated it as due on receipt. And 21 customers were paying fifteen or more days early, which the report called pure negotiating capital.
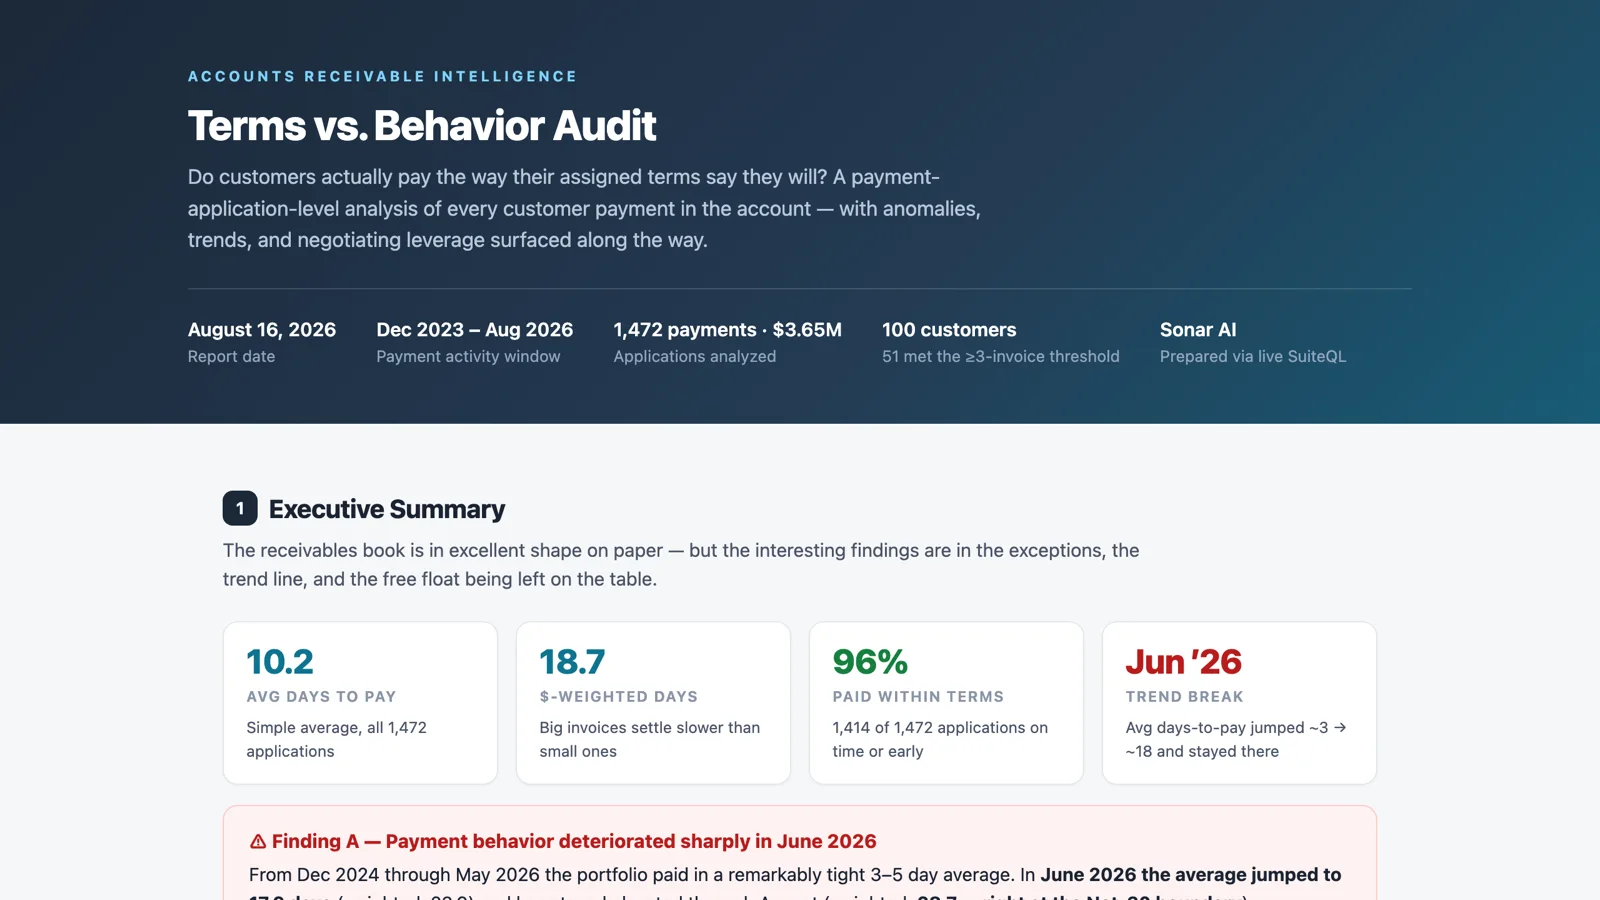
Sample report: Terms vs. Behavior Audit.
Two companion prompts have their own posts. The Customer Health Matrix puts every customer on a grid, and Customer Health Scoring turns order cadence, basket contraction, and days-to-pay drift into an early-warning system with a named rep for each at-risk account.
Are the Add-Ons Performing?
Every board meeting for a buy-and-build company has the same question: are the add-ons performing to the deal model? The Add-On Acquisition Synergy Tracker answers it from entity-level general ledger evidence. It identifies each add-on entity from its posting history, then measures what the integration has actually delivered. Cost synergies are checked by category, and each one has a falsifiable test. Zero shared vendors between the platform and an add-on means procurement consolidation hasn't started, whatever the plan says. It hunts one-time integration costs even when nobody tagged them, tests whether revenue synergies can be measured at all, and builds a pro forma EBITDA bridge tied to the consolidated statements.
The deal-model targets aren't in the ERP, so they plug in as parameters, and until they're supplied the tracker runs with placeholders that are shaded and labeled as such. I'd rather a report say "illustrative" in plain sight than guess. In the test account, the tracker found three add-ons, measured a 30 percent cost-out in one of them with margin improving every month since close, found zero procurement synergy evidence, flagged that add-on's revenue synergies as unmeasurable because its revenue posted as twelve summary journals, and caught a $130K integration-cost anomaly in July.
Sample report: Add-On Acquisition Synergy Tracker.
This one pairs with the 100-Day Plan Financial Baseline. First you set the baseline, then you track the deal. Both are covered in my post on what Sonar AI offers PE-backed companies.
Wrapping Up
What I like about this set is how often the finding contradicts the assumption. The discounting problem ran the other way. The receivables book looked fine and had a trend break in it. The treemap's biggest tiles aren't its most profitable ones. When the analysis starts from the transactions rather than from a belief about the business, it's allowed to disagree with you, and that's when it earns its keep.
Revenue Treemap Builder is free. The other three are in the paid tier of the Sonar AI Prompt Library: Pricing Experiments (Elasticity by Segment & Quote-by-Quote Rep Guidance), Terms vs. Behavior Audit, and Add-On Acquisition Synergy Tracker. The free Sales Growth Opportunity Audit is a good companion to all four.