Five of the thirteen months in this review of my NetSuite test account were peak months, and every one of them coincided with an invoice from an information technology or consulting customer. Remove those two segments and the monthly revenue range narrows from $75K-to-$246K to $75K-to-$154K.
That's the finding the Revenue Mix by Customer Segment prompt is built to surface. It stacks thirteen months of general ledger revenue by the customer's segment and separates the steady base business from the lumpy project layer sitting on top of it. It went into the Sonar AI Prompt Library in September. If you're new to this, Sonar AI is an AI agent that runs inside NetSuite. Every prompt in the library is a playbook that I engineered and tested against live NetSuite data, and you run it inside your own account, against your own records. Nothing leaves the account, and nothing is written to it.
Two Businesses in $1.93 Million
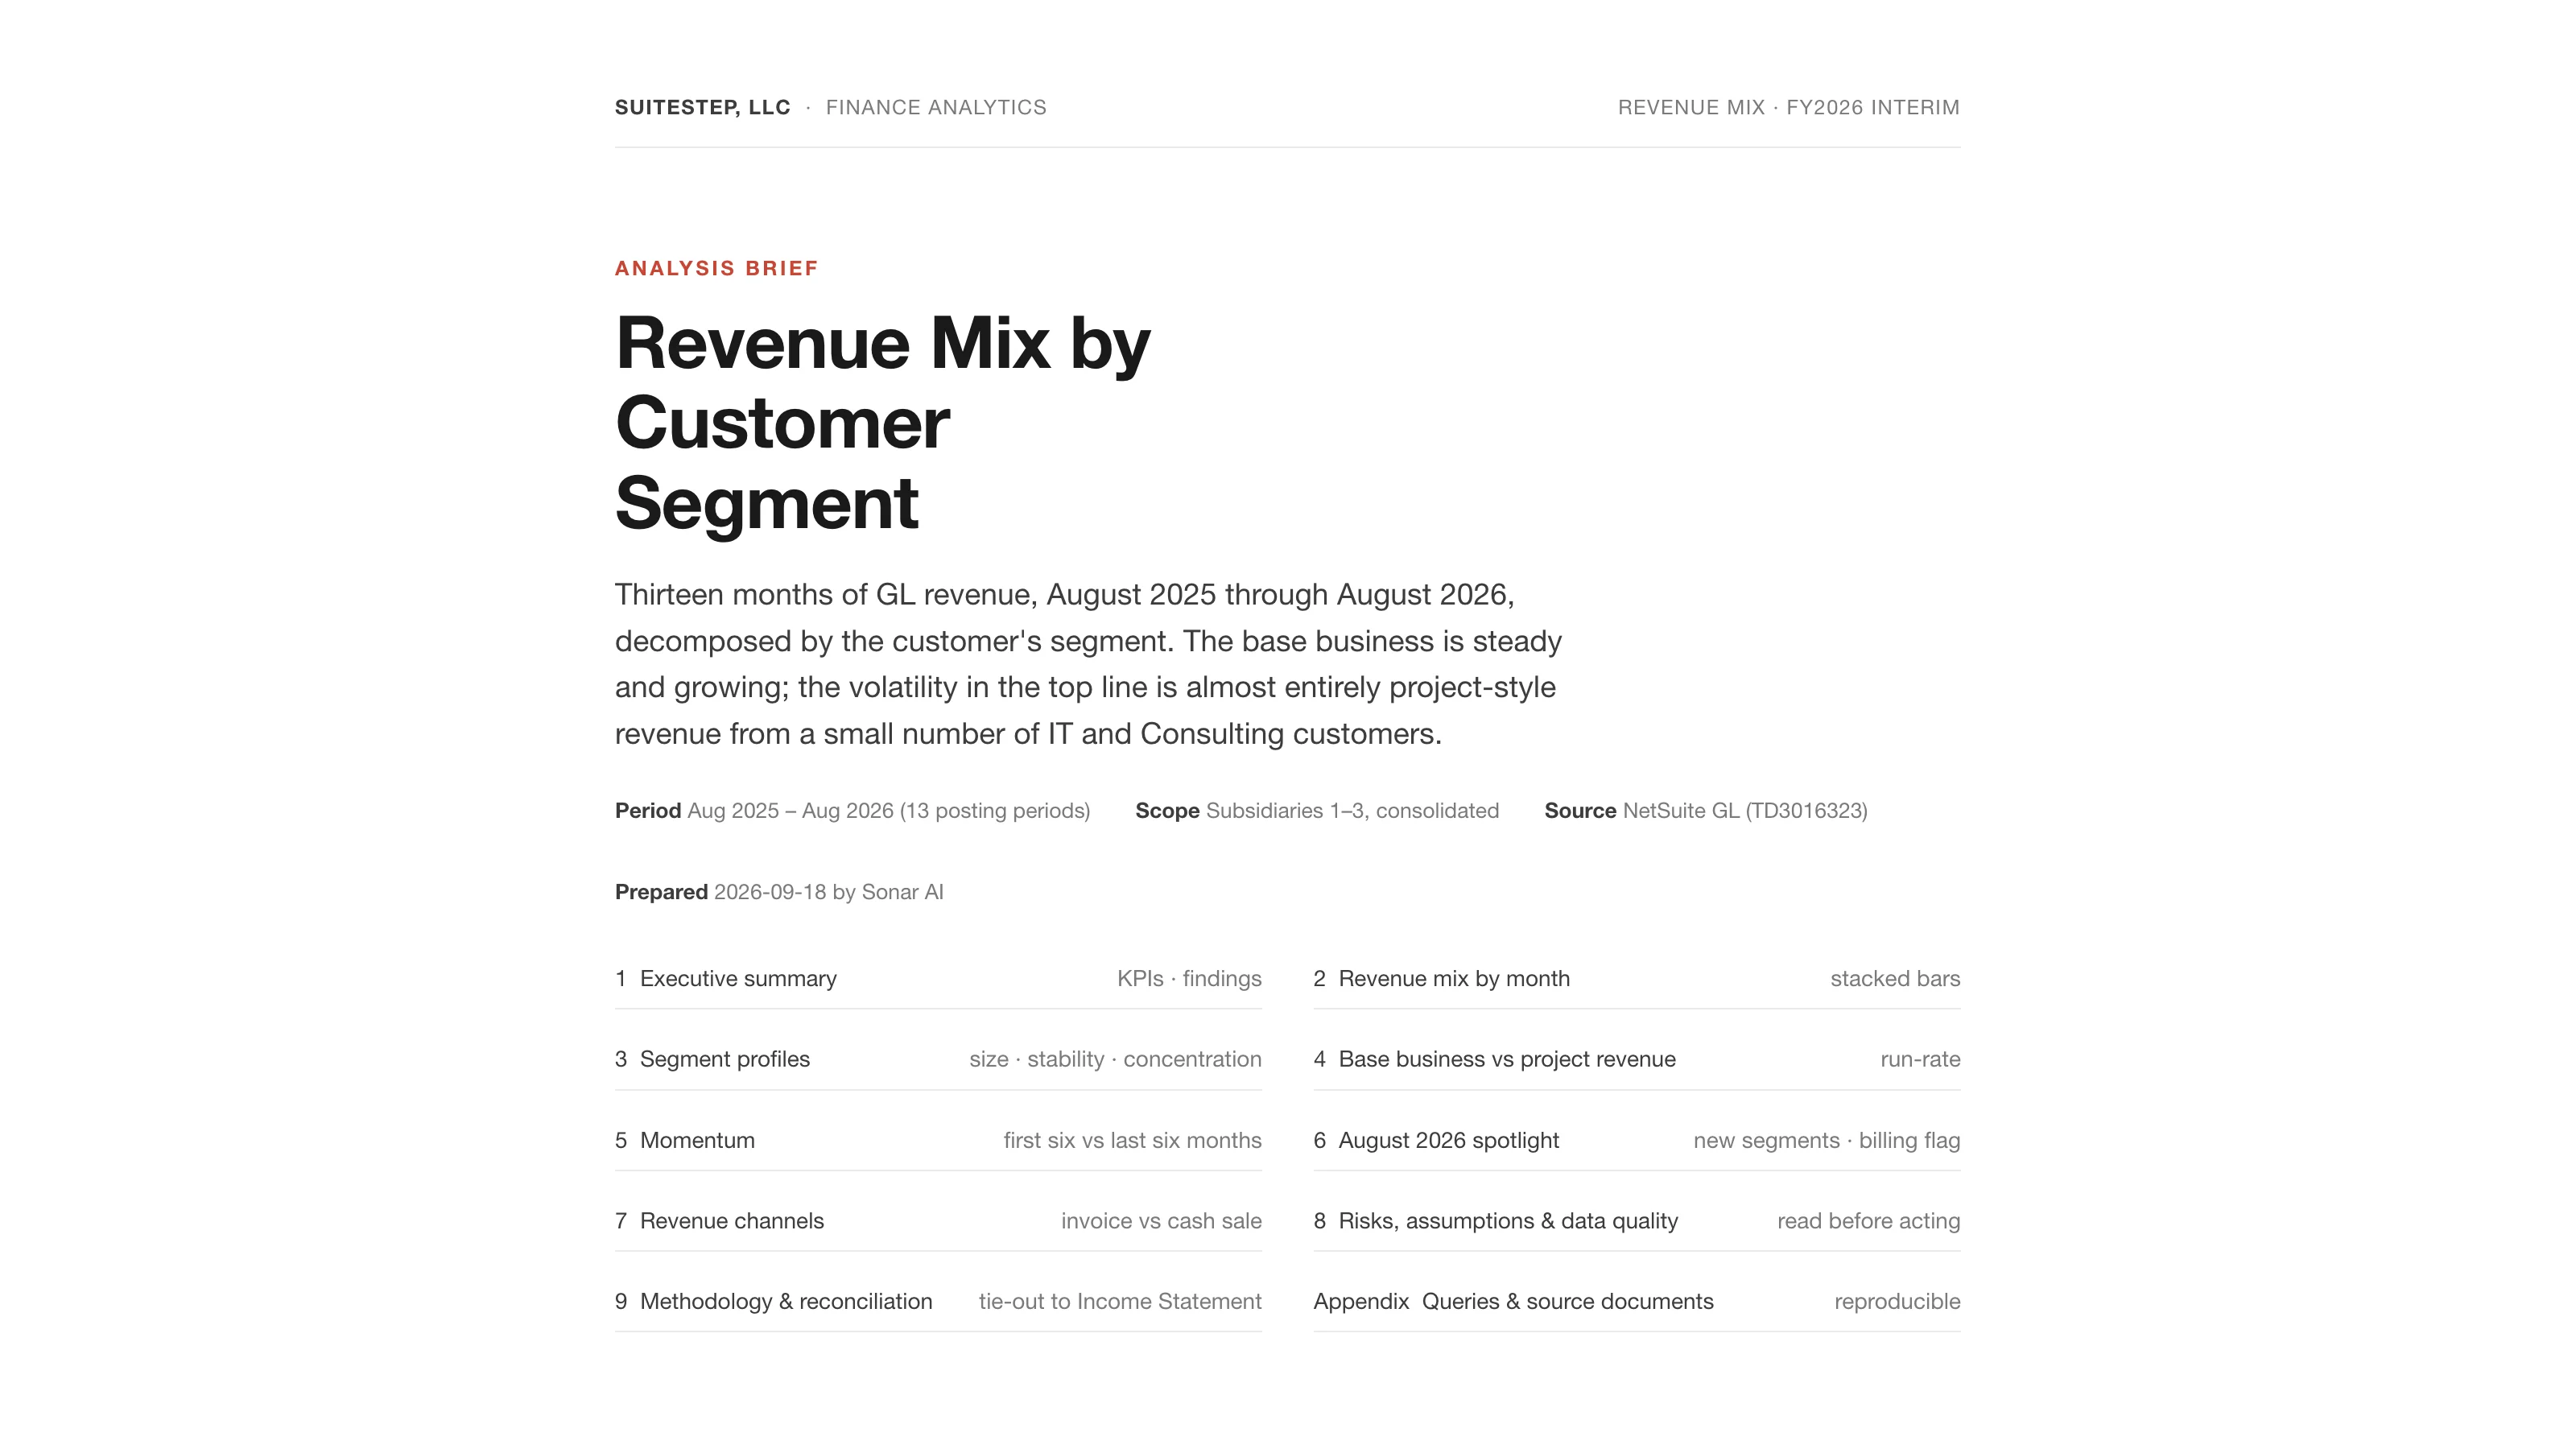
Thirteen posting periods, August 2025 through August 2026, $1.93 million of revenue, tied to the income statement to the cent. Manufacturing is the largest segment at 35.8% with nine customers. Manufacturing, retail, and consumer sales posted revenue in all thirteen months, together average $96K a month, and have a coefficient of variation of 0.22, which the report's own scale calls steady. Information technology and consulting appeared in five and four months respectively, and still supplied $607K, which is 31.5% of the total.
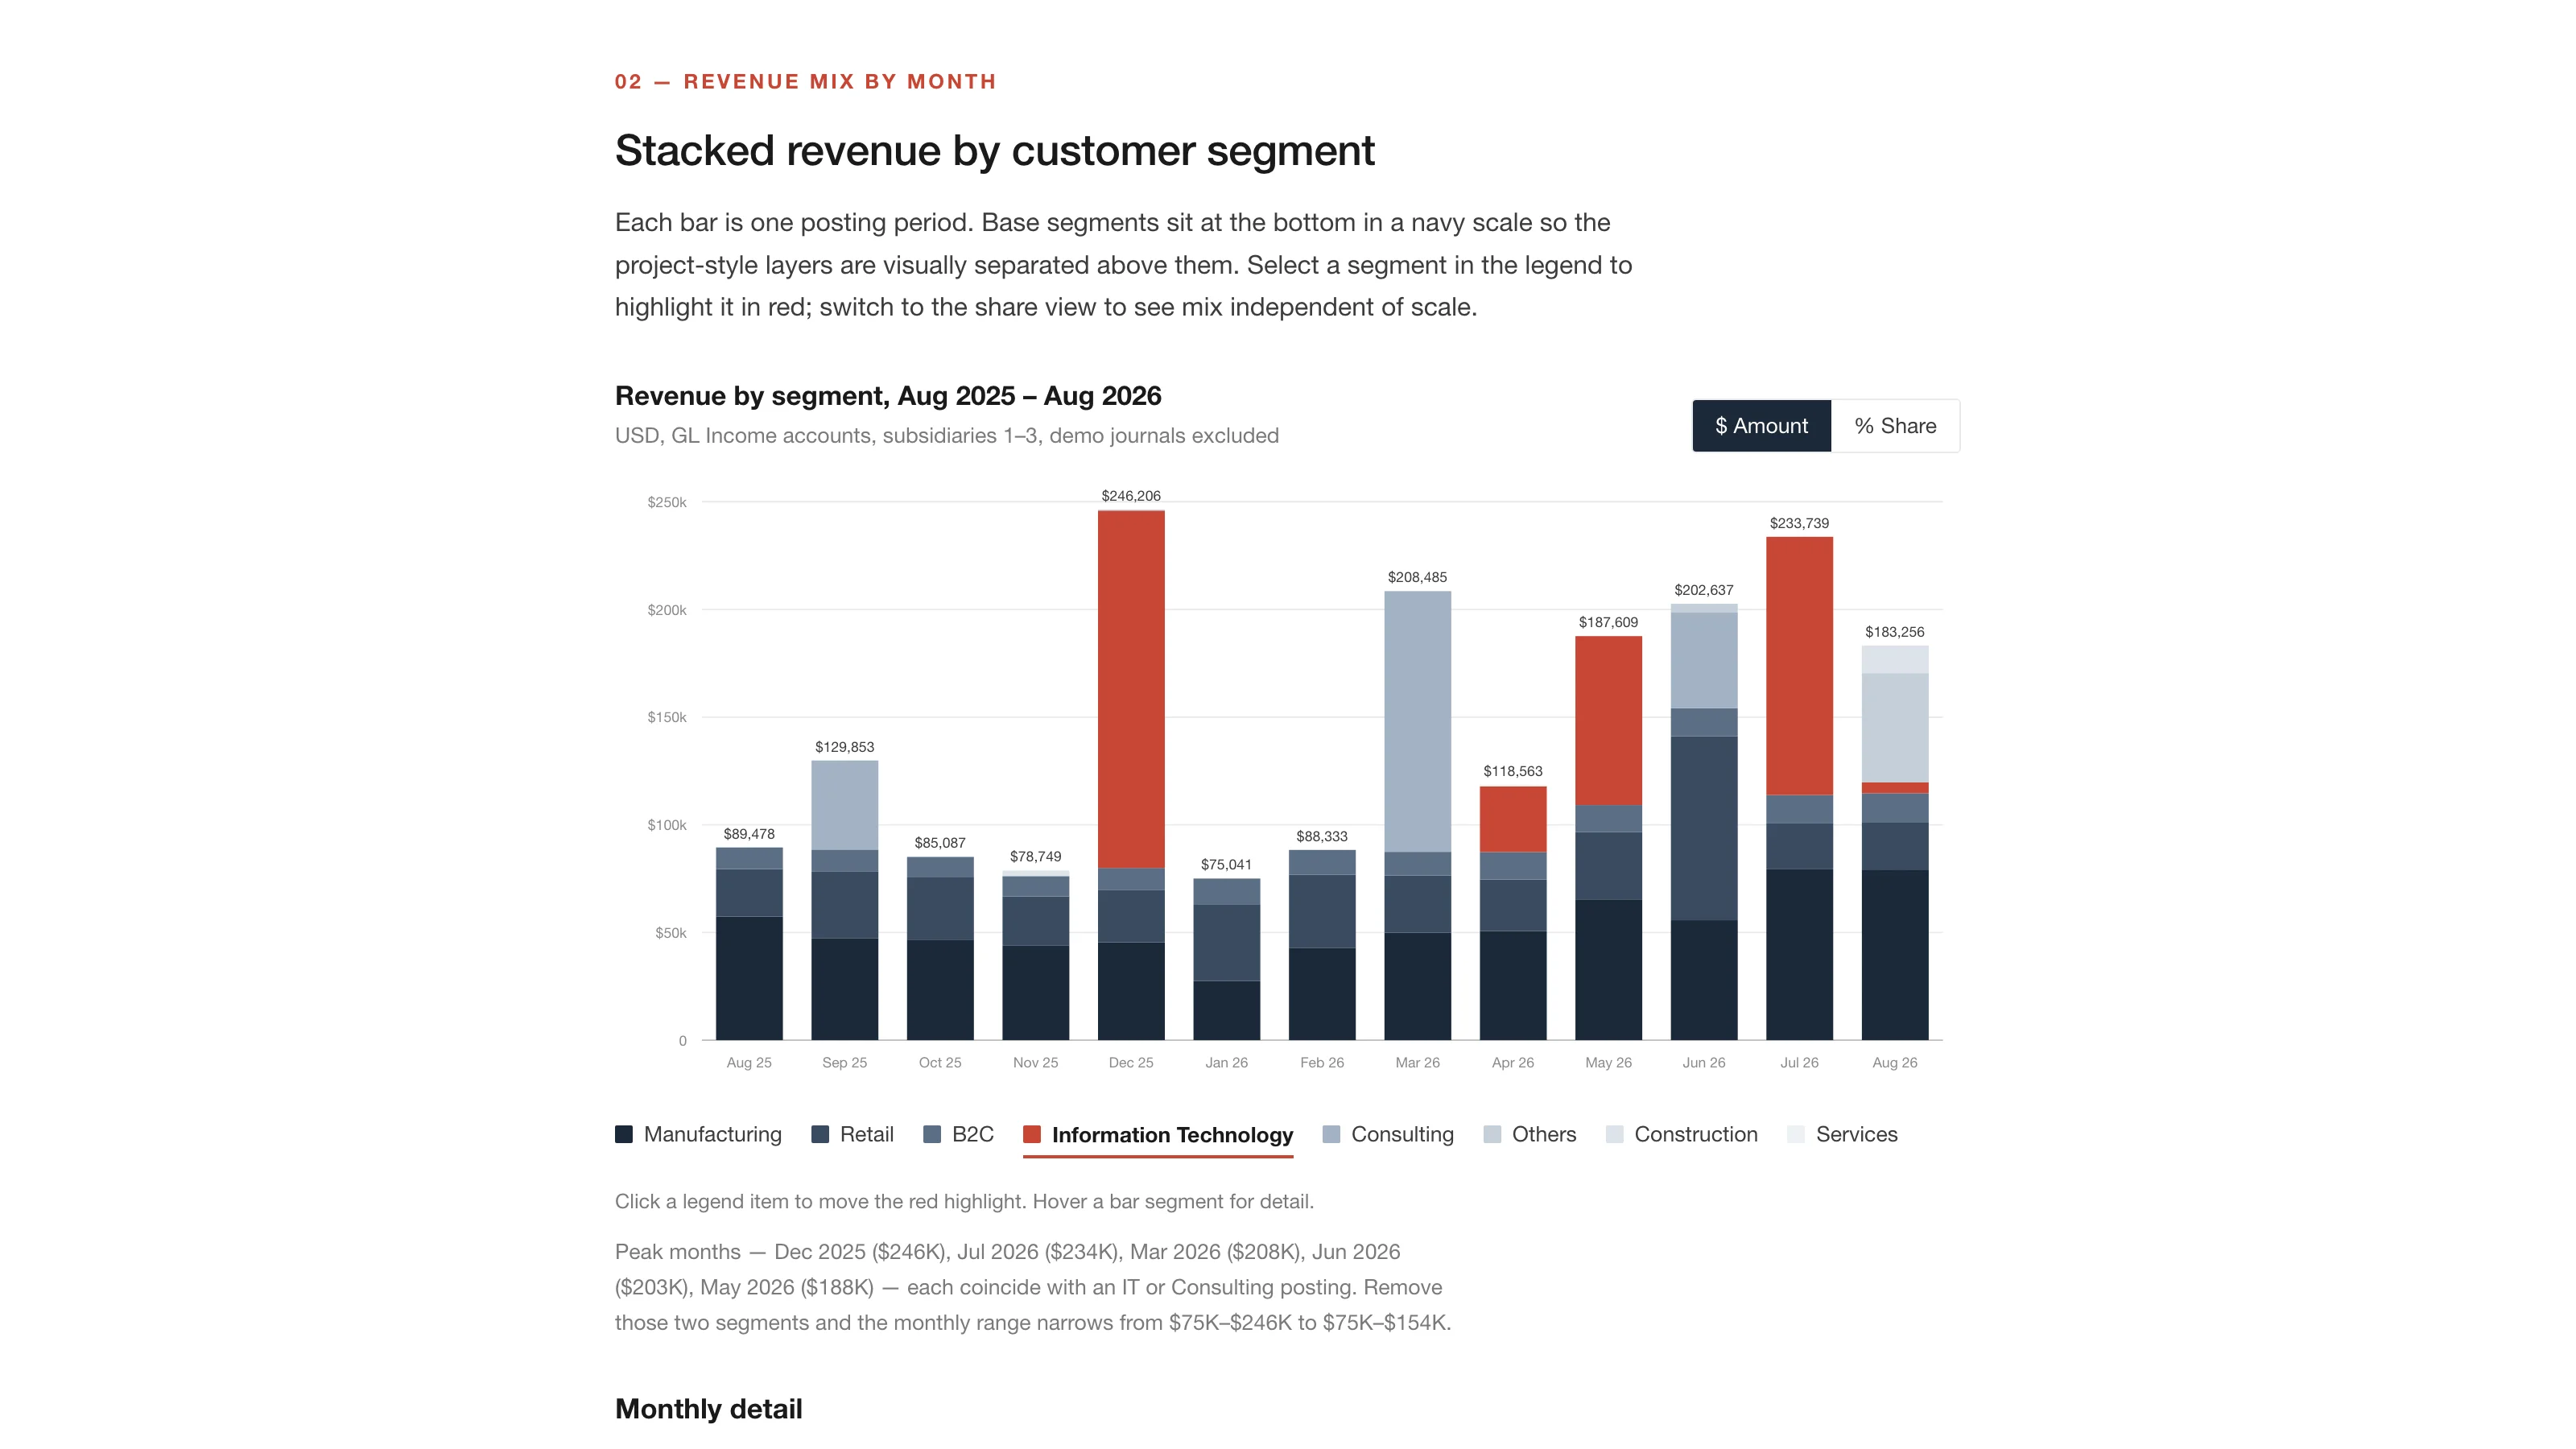
So the report groups the three every-month segments as base and the rest as project, and reads the two separately. Base revenue averages $96K a month with a range of $75K to $154K. Project revenue is $678K over the window, 35.2% of the total, arriving in nine of thirteen months. The stated risk at the end of the report is the reason this matters: a planning model built on the $1.93 million total without separating the project layer overstates the reliable run-rate by about half.
The growth is real, though, and it's broad. Comparing the first six months with the last six, with February excluded so the halves are equal, manufacturing grew 42%, retail 28%, consumer 23%, IT 41%, and consulting 297%. All three base segments grew by double digits, which the report says rules out a mix-only explanation. The consulting figure is one account, Red Rivers Consulting, which posted $94K in the second half.
Concentration Inside Each Segment
In every business-to-business segment, the top three customers account for 65% to 78% of the segment's revenue. Jones Manufacturing alone is $192K, 10% of the company. The consumer segment is the mirror image: 60 customers, none above 4% of the segment. The report scores each segment on three things at once, size, stability, and dependence on its largest customers, and concludes that manufacturing is the only one that's large, steady, and diversified enough to plan around.
August Needs a Second Look
August 2026 was the first month with six segments active. Two of them, Others and Construction, had been immaterial or absent, and together they contributed $63.5K, a third of the month.
The Others jump is three invoices to Macgruber Incorporated in one posting period, each for an identical $16,884.00. The report says that's consistent with legitimate milestone or recurring billing and equally consistent with duplicate entry, that two of the three are 18% of August revenue, and that they should be confirmed against the underlying sales orders before August is used in a forecast or a commission calculation. If you read the order-to-cash post, then you know how that turned out. Separately, Macgruber is now the sixth-largest customer in the company and sits in a residual category, invisible to any segment-based reporting.
How Each Segment Is Billed
Every business segment is invoiced. IT and consulting average $33K to $35K per invoice on eighteen invoices combined, which is 31% of revenue on 1.8% of transactions. The consumer segment's 842 transactions average under $200 and it's the only segment with a meaningful cash-sale channel. Two item receipts posted $149.95 to an income account, which the report calls unusual and immaterial, and worth a look by whoever owns the returns process.
What the Segment Field Is
The report is careful about its one dimension. "Customer segment" means the standard NetSuite Customer Category field, because it's the only populated segmentation in the account. A custom client-tag segment is set on every customer but isn't resolvable to a label through SuiteQL here, so it wasn't used. Eighteen of 273 customers have no category, none of which generated revenue in the window, so there's no Uncategorized slice today, and there will be the first time one of them is invoiced. And the taxonomy is mixed: seven categories describe an industry and one describes a channel, so a customer can legitimately be both, and the report suggests a two-axis scheme before the book grows.
The synthetic monthly journals on this account are 83% of ledger income in August, $923K of $1.1 million. The report ties the unfiltered total to the income statement to the cent, which validates the join path and the sign convention, and then excludes the journals as a deliberate, documented departure rather than a discrepancy.
Wrapping Up
Six SuiteQL queries in the appendix with their row counts, a glossary, and a note that all arithmetic was performed programmatically from the query output with nothing hand-computed. The companion to this one is the Customer Profitability Review, which takes the same customers and ranks them by what they leave after cost.
Revenue Mix by Customer Segment is in the paid tier of the library. The full sample report from the test account is online, and I covered the whole September release in a separate post.
Forecast those five peak months as the new normal, and you'll be planning for a company you don't have.