Your customers rarely announce that they're leaving. They just go quiet. Or they keep ordering while their baskets quietly shrink, and the revenue total looks fine right up until it doesn't.
The signals are already in NetSuite. What's missing is someone reading them against each customer's own history. That's what a prompt I added to the Sonar AI Prompt Library this week does. It's called Customer Health Scoring, and it turns the order and payment data that's already there into an early-warning system.
If you're new to this, Sonar AI is an AI agent that runs inside NetSuite. Every prompt in the library is a playbook that I engineered and tested against live NetSuite data, and you run it inside your own account, against your own records.
Three Leading Indicators
The prompt scores every customer on three signals. Order cadence, measured against the customer's own rhythm rather than a global window, because sixty days of silence is business as usual for a quarterly buyer and a five-alarm signal for a weekly one. Basket contraction, meaning average order value and the number of distinct items per order, which catches what revenue totals hide. And days-to-pay drift, computed from real invoice-to-payment application links rather than from a date field that turns out to be a system artifact.
Within each signal, the worst indicator counts most. A customer that's silent for four times its own cycle is the finding, and averaging that with two mild signals would dilute it away.
Validate Before Weighting
The part of this prompt that I'd defend hardest is that it tests each signal against the instance before it trusts it.
The lazy way to get days-to-pay is to subtract the invoice date from the close date. The prompt runs that side by side with the real payment application links, and if the close date shows a uniform mechanical lag while the links show real spread, the close date is an artifact and it's thrown out. Then it checks whether the signal varies at all. In the test account, 89 percent of applied invoices paid the same day, so payment drift couldn't be a primary detector there. The prompt demoted it to a corroborating signal and said so in the findings. A scoring model that weights a flat signal heavily is theater.
It also splits the book in two before scoring. Customers with fewer than five orders can't produce a trend, because cadence math on two data points is noise. But the prompt doesn't drop them. It triages them separately by open receivables, and that's where the largest finding in the test run turned up.
What It Found
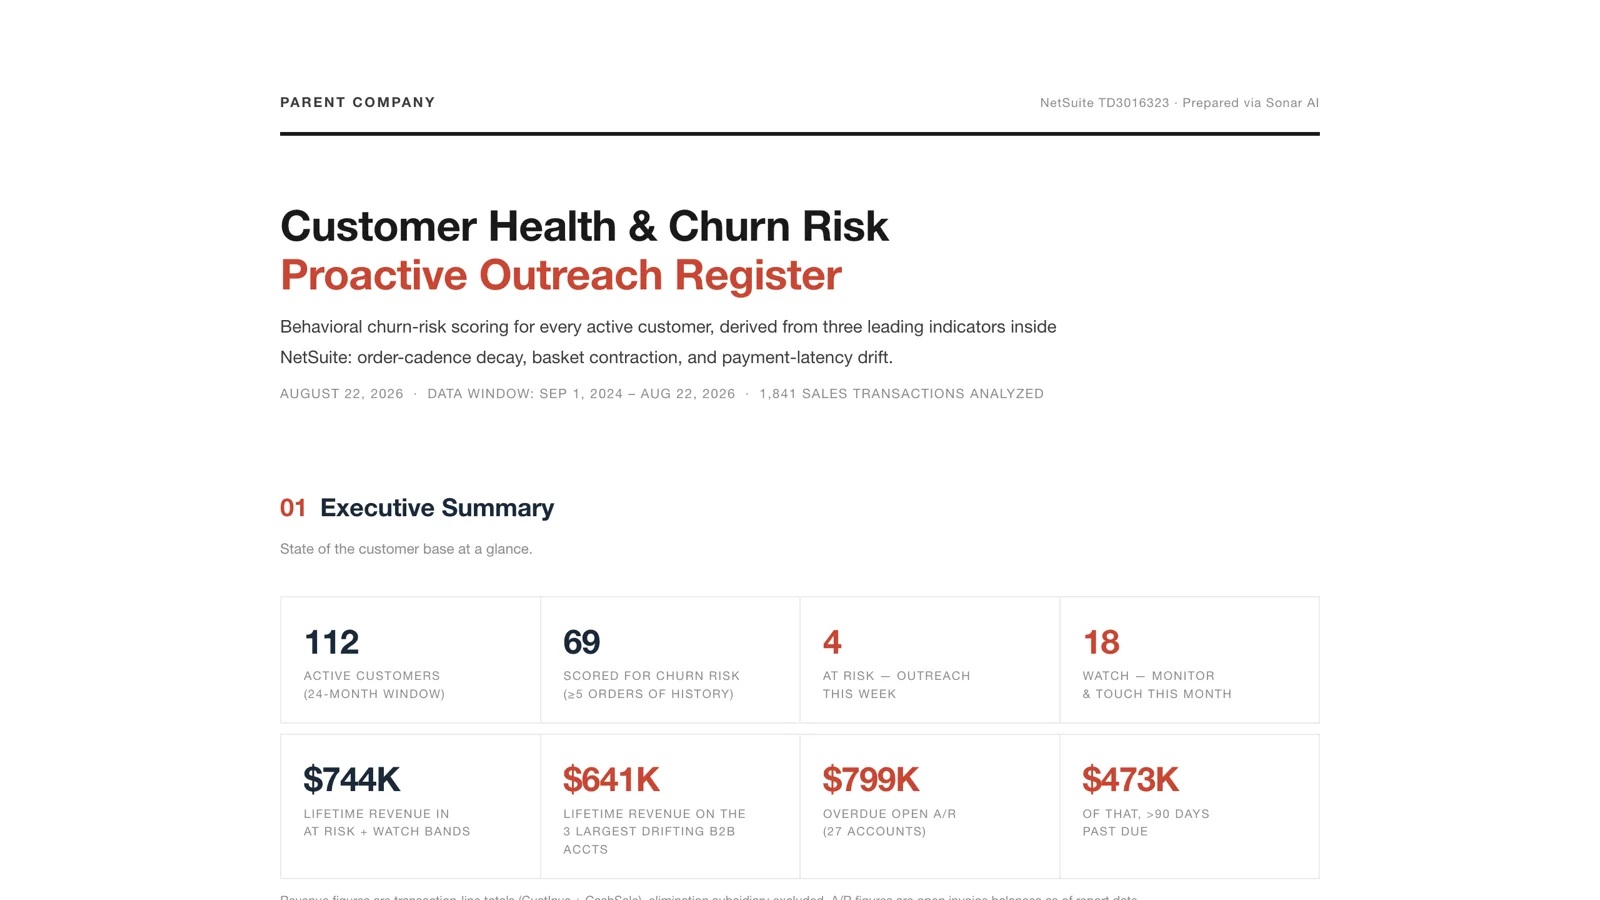
I ran it against one of my NetSuite test accounts: 112 active customers over two years, 69 with enough history to score. Four came back at risk and eighteen on watch, with $744K of lifetime revenue between them.
The clearest case was a customer that had ordered on a steady 31-day rhythm for twenty orders and then gone silent for 123 days, nearly four times its own cycle. Order count had fallen from six to two across the last two half-years. No open balance, no dispute on record. It had simply stopped ordering.
The more interesting case was a customer whose order frequency had risen from six to fourteen while its average order value halved and its basket narrowed from eleven distinct items to seven. Revenue looked healthy. The relationship was hollowing out, which is the classic pattern of a customer moving share to another supplier. That's the archetype that reps least expect, and it hit a $239K account.
The largest account in the book, at $317K lifetime, showed early drift: order value down 49 percent and days-to-pay up, while the cadence still held. The report called it the cheapest possible moment to intervene.
And the unscoreable cohort held $473K of receivables more than ninety days past due. Five accounts had each placed one large order on terms, never paid in full, and never returned. Those don't belong with retention. They route to collections, and the prompt says so. It also names the process finding underneath: a recurring shape of large first order, immediate terms, no credit check, and no payment is an onboarding-controls gap, not five independent bad actors.
Route, Don't Just Rank
A score persuades nobody. "Silent 123 days against a 31-day rhythm, orders six to two" gets a call made. Every scored account gets a driver narrative generated from the same arithmetic that produced its score, so the two can't drift apart. Then the register ends in queues: which rep owns which account this week, with a play per archetype. A cadence break gets a reorder call. Basket decay gets a line-level win-back. Payment drift on a flagship account gets an executive review.
The thresholds are stated up front and labeled as judgment, not fitted parameters, with a recommendation to back-test them against realized churn after a few monthly cycles. False precision would destroy the register's credibility the first time a rep disagreed with a score.
You can see the full register from this run here: Customer Health and Churn Risk, August 2026. It ships with a companion CSV of the full scored roster, in a deterministic order, so monthly re-runs diff cleanly.
How It Differs From the Health Matrix
Earlier this month I wrote about the Customer Health Matrix, and the two prompts are easy to confuse. The Matrix is a snapshot: every customer plotted by payment behavior against revenue, so you can see at a glance who to collect from and who to take care of. This prompt is a trend: it measures each customer against its own history to predict who's about to leave. The Matrix tells you where the book stands today. This one tells you where it's heading.
Who It's For
Wholesale distributors, manufacturers with repeat B2B customers, and e-commerce and retail operators. Any business where revenue depends on customers who reorder.
It's in the paid tier of the Sonar AI Prompt Library now, under "Customer Health Scoring."