There's a category of financial report that has to survive a skeptical reader. A board member, a lender, an investor's analyst, an auditor. The numbers have to reconcile, the method has to be stated, and every figure has to be traceable to something the reader could check.
Five prompts in the Sonar AI Prompt Library are built for that category. Two of them work from NetSuite's own report engine, one traces GL movement to the documents that produced it, one reads risk from the ledger, and one explains the system itself to people who've never logged into it. This post walks through each, with what they produced in one of my NetSuite test accounts.
If you're new to this, Sonar AI is an AI agent that runs inside NetSuite. Every prompt in the library is a playbook that I engineered and tested against live NetSuite data, and you run it inside your own account, against your own records.
Built From NetSuite's Own Reports
Most prompts in the library query the ledger directly with SuiteQL. Two of the prompts here deliberately don't. They run NetSuite's own financial report engine, because for a statement that's going to a board, the numbers have to match what the controller sees on screen.
EBITDA Comparative Income Statement runs the income statement for the current and prior-year periods, verifies both extractions, and builds a formal comparative statement with EBITDA integrated: variance analysis, an EBITDA bridge, margin trends, a forensic anomaly scan, a documented assumptions register, and a methodology appendix. EBITDA is reconciled two ways, top-down and bottom-up, and the report says so in the document.
For the eight months ended August 2026 in the test account, revenue was $8.39M, up 19.1 percent, and EBITDA was $1.20M, up 64.8 percent, with the margin expanding almost four points to 14.27 percent. The report explained the gap between those two growth rates: cost of sales grew 15.2 percent against revenue growth of 19.1, and operating expenses excluding depreciation grew 10.6 percent, roughly half the rate of revenue. It also noted what deserved a second look, including that no income tax expense had been recorded in either period.
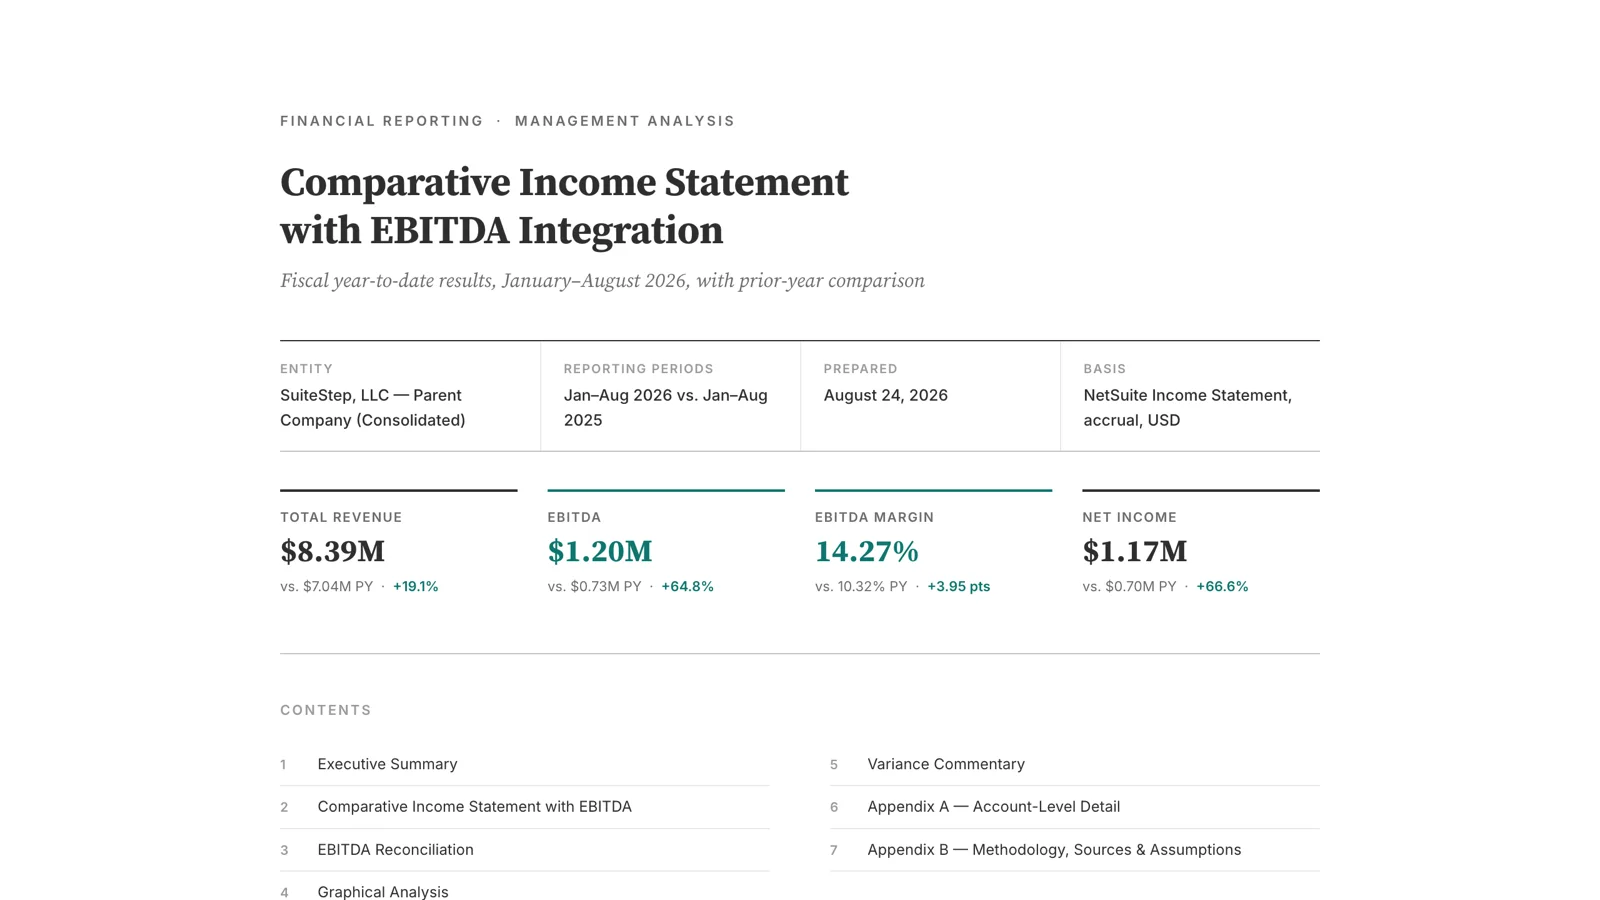
Sample report: Comparative Income Statement with EBITDA Integration.
Financial Performance Overview is the free companion. It's a single-period overview with a segment breakdown, prior-period and prior-year benchmarks, health ratios, and risk indicators, built entirely from NetSuite standard reports. If you want to see what a board-ready report from Sonar looks like before buying anything, this is the one to run.
Why Did This Account Move
Every month, someone on the finance team gets asked the same question: why did this account move? Answering it means pulling GL detail, chasing journal memos, and reverse-engineering reclasses, and it can take days.
MD&A Drafting Pack does that work. It sweeps period-over-period GL movement, flags every material account, and traces each movement to the specific invoices, receipts, adjustments, and journals behind it. Before any narrative is written, it runs a transaction-type decomposition as an integrity test, and it detects standing allocation journals that set the base, so that the narrative explains the variance rather than the formula. It flags mispostings as reclass recommendations, and the deliverable is a plain-English document with a clickable source-document index.
The July-versus-June run in the test account is a good illustration of what "traced to source" means in practice. Revenue was down $41,774, or 3.6 percent, and net income was down 18 percent. The report found that almost all of it was one customer event: an $89,343 invoice in June that didn't recur. Three identical $16,884 wholesale invoices in late July recovered a little over half of the gap. Operating expenses moved by $219. Below the operating line, it caught a $2,000 legal-fee accrual that had been booked into a debt account, misstating both accrued liabilities and the line of credit, and recommended the reclass before close. It also traced two fixed-asset entries to lease-proposal rework in the Fixed Assets module, effectively a category reclass rather than two purchases, and asked finance to confirm the intent.
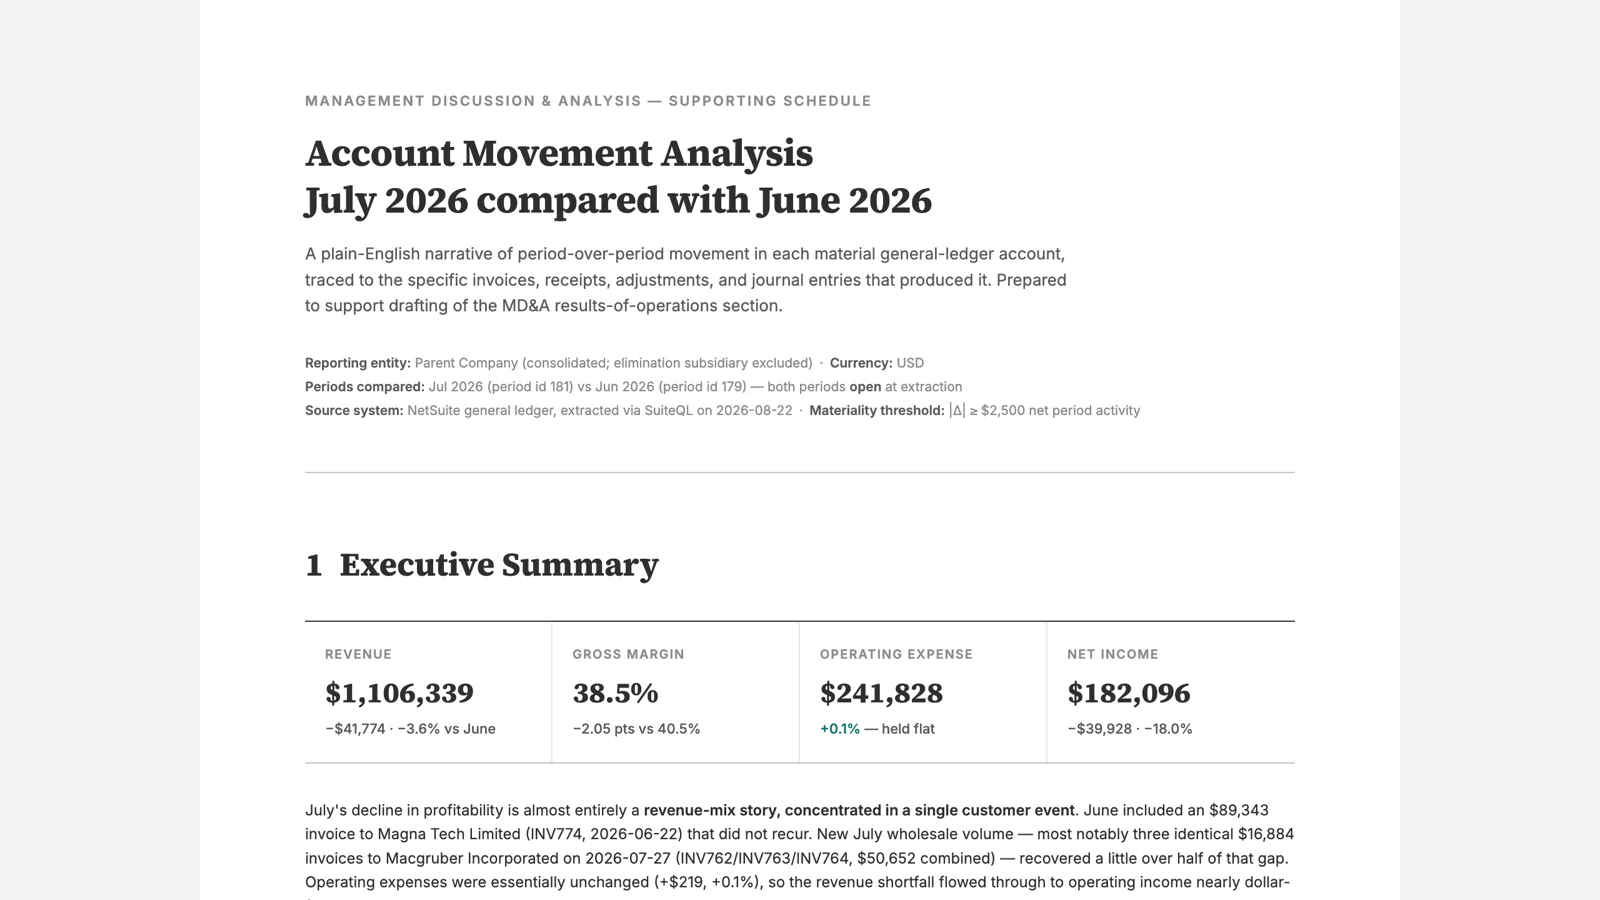
Sample report: Account Movement Analysis: July 2026 vs June 2026.
Risk, Read From the Ledger
Risk Exposure & Risk Appetite Assessment evaluates fiscal-year risk exposure against live financial performance across credit, concentration, liquidity, inventory, and data integrity, and then recommends quantified risk appetite levels, with a value bridge that shows what rebalancing is worth and a 90-day action program.
The assessment of the test account fit in one paragraph, and I think it's a good example of the kind of judgment the prompt is designed to produce. The business was outperforming on every profitability metric, with revenue up 19.1 percent and net income up 66.6 percent, while carrying a materially mispriced credit position: 86 percent of open receivables were past due, and half sat beyond 90 days. At the same time, the balance sheet was over-defended. A quick ratio of 3.2 and an eight-day payables cycle were idling roughly $1.8M of deployable capital. The correct move wasn't uniformly "less risk." It was a rebalancing: tighten credit appetite sharply, raise capital-deployment appetite deliberately, and close the data-integrity gaps that were blinding dimensional reporting.
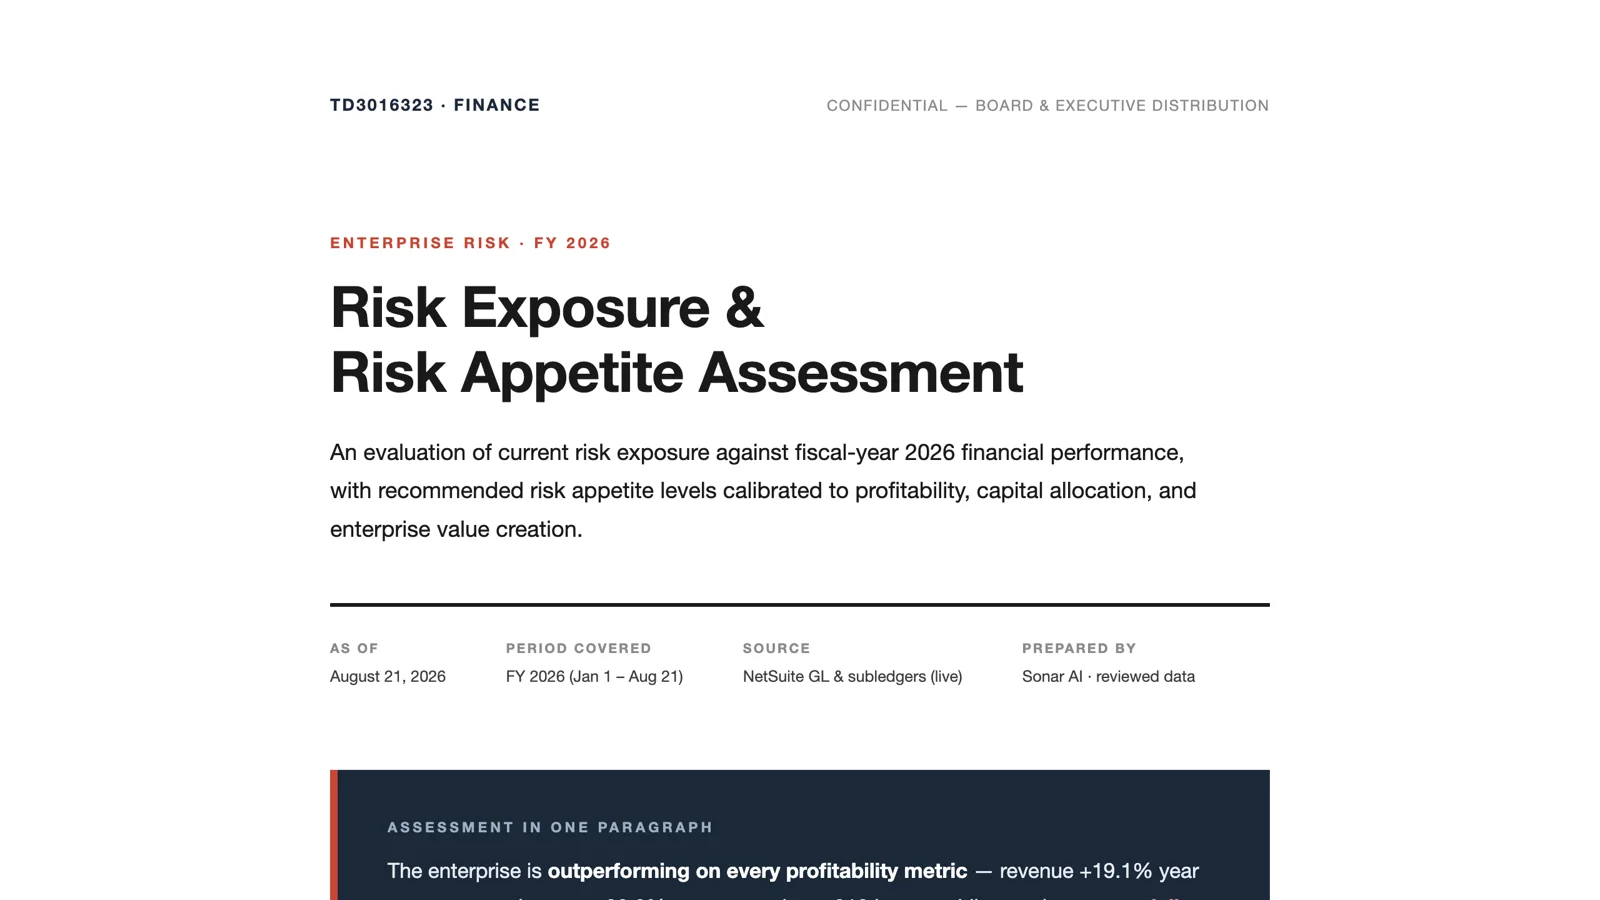
Sample report: FY 2026 Risk Exposure & Risk Appetite Assessment.
Explaining the System Itself
Explain the ERP to the Board: One-Pager is a different kind of report. Its audience has never logged into NetSuite and never will. It translates the footprint into board language: what's automated, what still requires people, where the operational risk sits, what the system costs in management attention, and a defensible funding ask.
The one-pager for the test account led with throughput. 4,364 transactions in the trailing twelve months, about 17 per business day, with volume up 55 percent in the most recent four months and absorbed with no added headcount. 98.5 percent of that volume flowed through structured, automated cycles. Manual journal entries, the accounting equivalent of hand-typing, numbered 64 all year. The report showed the two commercial engines of the business as closed loops, with document counts along each chain to prove it: orders became shipments, invoices, and receipts at nearly one-to-one ratios. The funding ask followed from the gap: bring the sales pipeline into the system, because everything downstream of a signed order was already automated and everything upstream of it was invisible, at a company where 88 percent of revenue rode on a small number of wholesale relationships.
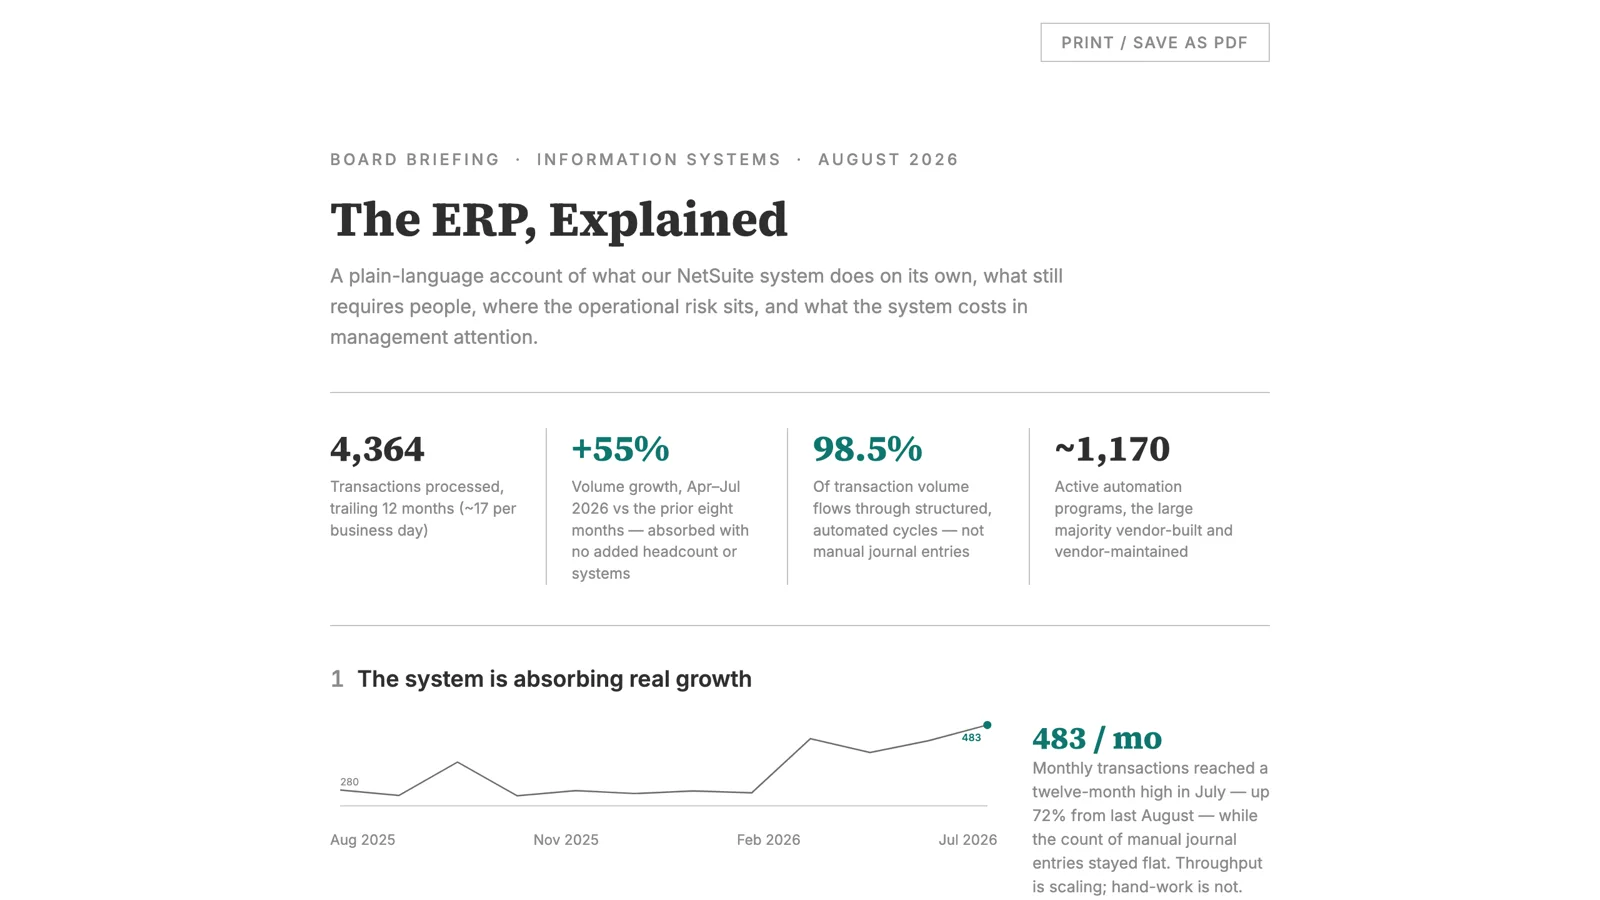
Sample report: The ERP, Explained: Board Briefing.
The Companions
Two other pieces belong to this suite. The Enhanced Balance Sheet, which is free, turns NetSuite's comparative balance sheet into a position analysis with a derived cash-flow bridge that has to reconcile to the penny. And the four prompts in GL Forensics From Raw Postings take the opposite approach to the two report-engine prompts above: they build their statements from cumulative postings and prove them with tie-outs. Between the two approaches, you get a statement that matches the controller's screen and an independent check on whether that screen is right.
Wrapping Up
The reports in this post aren't more sophisticated than what a good finance team already produces. What's different is the time, and the audit trail. Each of these took minutes, and each one carries the queries and assumptions that produced it, so a reader who doubts a number can go and check it. For a report that has to survive a skeptical reader, I've come to think that the audit trail is the product, and the numbers are the packaging.
Four of the five are in the paid tier of the Sonar AI Prompt Library: EBITDA Comparative Income Statement, MD&A Drafting Pack, Risk Exposure & Risk Appetite Assessment, and Explain the ERP to the Board. Financial Performance Overview is free.