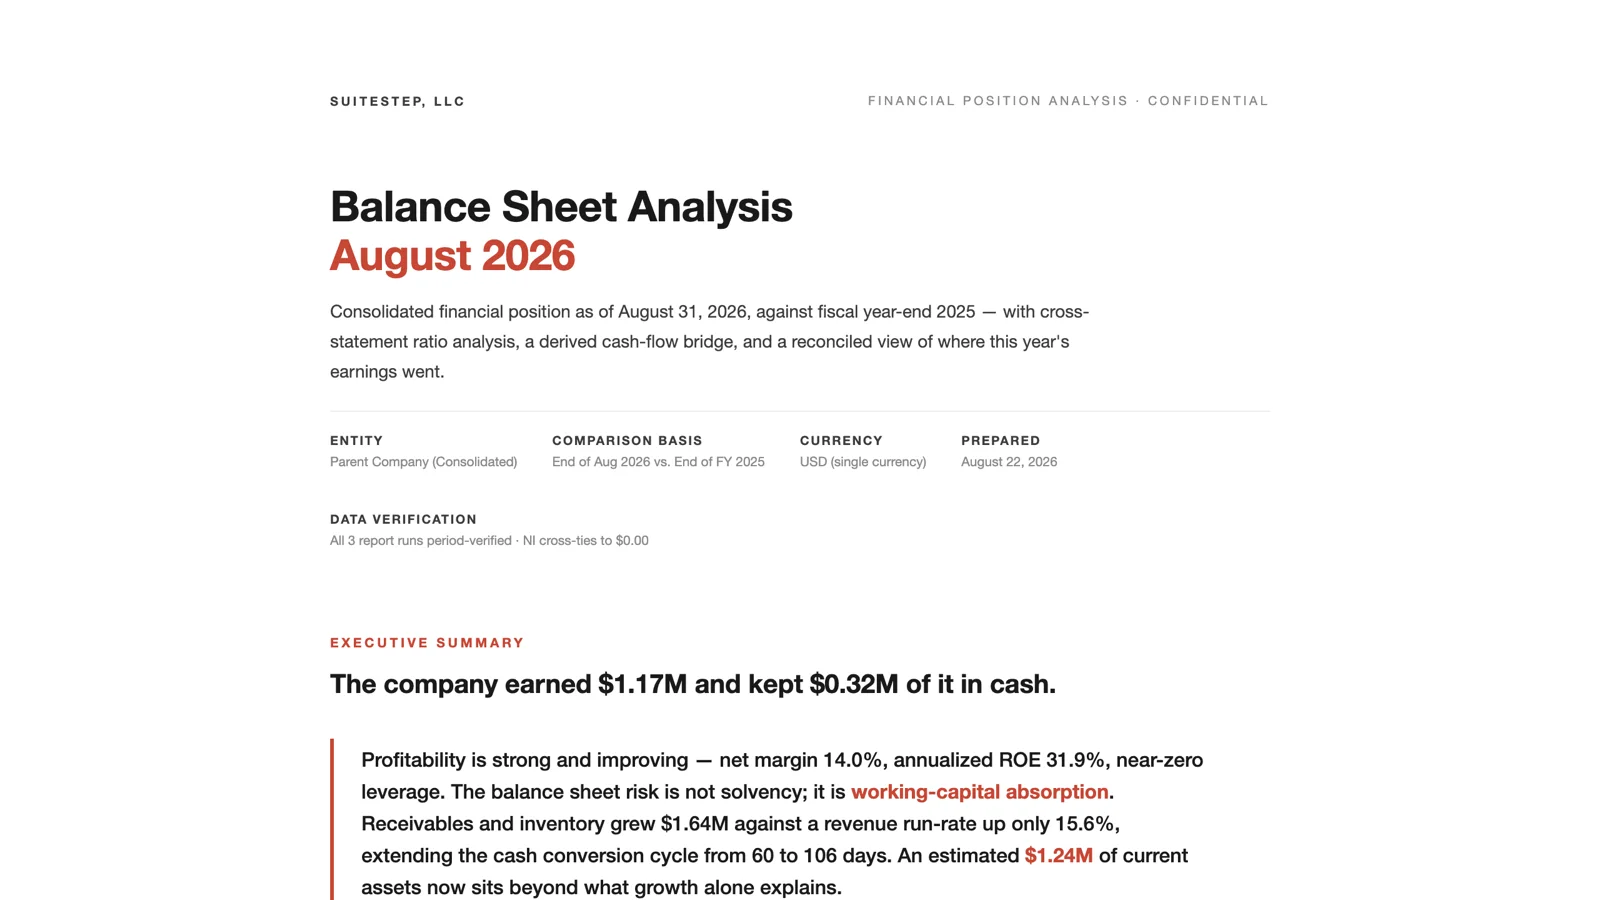
The company earned $1.17M this year and kept $0.32M of it in cash. Where did the rest go?
NetSuite's comparative balance sheet can't answer that. It tells you what changed between two dates, line by line, and it leaves the why to you. I've been working on a prompt that takes that standard report and turns it into a financial position analysis, and it'll be in the next release of the Sonar AI Prompt Library, in the free tier. The centerpiece is a cash bridge that has to reconcile to the penny.
If you're new to this, Sonar AI is an AI agent that runs inside NetSuite. Every prompt in the library is a playbook that I engineered and tested against live NetSuite data, and you run it inside your own account, against your own records.
The Report Engine, Not SQL
Most of the prompts in the library work from SuiteQL. This one doesn't, and that's deliberate. The statements come from NetSuite's own report engine, so every figure matches what a user sees in the UI. The prompt checks the report's period flags on every run, so it knows the requested period filters were applied and isn't guessing. And it uses one comparative run rather than two single-period runs, because that's how NetSuite itself lines the columns up.
Before it computes anything, it proves the inputs. The net income line on the balance sheet has to equal the income statement's net income exactly. Assets have to equal liabilities plus equity in both periods. Retained earnings have to roll forward. Four tie-outs, and if any of them fails, the analysis stops there.
The Cash Bridge
Two balance sheets and a year-to-date net income figure contain enough information to derive an indirect cash-flow statement. Start with opening cash, add net income, subtract the growth in receivables and inventory, add the growth in payables, adjust for capex and depreciation and equity, and you should land exactly on closing cash.
The prompt requires that the bridge reconcile to the actual change in cash with a residual of zero. Not close. Zero. In the test run it did: $2,278,332.30 of opening cash, plus $1,174,240.26 of net income, less $704,007.05 of receivables build and $931,062.49 of inventory build, through the rest of the movements, to $2,603,008.01, which is the reported closing cash. Residual, $0.00.
I think that this is the part of the report that earns trust, because it proves the whole analysis from within. If the bridge reconciles, the two balance sheets and the income statement agree with each other, and every ratio built on top of them is standing on something.
What It Found
I ran it against one of my NetSuite test accounts, comparing the end of August 2026 with the prior fiscal year-end. Profitability was strong and improving: net margin up from 10.7 to 14.0 percent, annualized return on equity of 31.9 percent, near-zero leverage. The balance sheet risk wasn't solvency. It was working-capital absorption.
Receivables had grown 48 percent and inventory 78 percent, against a revenue run-rate up only 15.6 percent. The working-capital build of $1.76M had consumed one and a half times the period's net income. That's where the earnings went. The cash conversion cycle had stretched from 60 days to 106, and inventory turns had fallen from 5.6 to 3.6.
The prompt then does something I don't see in most balance sheet reviews. It asks how much of the working capital growth can be explained by revenue growth, holding the prior year's efficiency constant, and it reports the excess as a dollar figure. Here it was $1.24M of current assets sitting beyond what growth alone explains. "Inventory is up" is an observation. "$766K of inventory beyond what growth explains" is a number somebody can act on.
Two smaller findings. The current ratio improved from 4.43 to 4.71 while the composition moved the wrong way, with cash falling from 46 to 37 percent of assets and inventory rising to take its place. A current ratio can improve while liquidity deteriorates, and the prompt checks the quick and cash ratios for exactly that reason. And sales tax payable had nearly doubled, with four states appearing for the first time, which is a registration and filing-calendar question for the tax team before the fourth quarter.
The retained earnings line showed a 411 percent variance, which would alarm anyone reading quickly. The report defuses it with arithmetic: it's the mechanical roll-forward of the prior year's net income at close. Expected, not anomalous. The prompt requires that every false alarm be defused with numbers, not adjectives.
The Report
The deliverable is a single-column, print-ready HTML document with no external dependencies. It opens with the executive summary and eight key figures, then the cash bridge as a waterfall, the comparative statement with variance and common-size columns, the asset composition shift, the cash-cycle components, the growth-adjusted excess working capital, a 21-ratio cross-statement suite with a DuPont decomposition, and the findings in priority order, each classified as a flag, a watch, a strength, or hygiene. It closes with the sources, the tie-outs, and the assumptions, including the day counts used to annualize.
You can see the full report from this run here: Balance Sheet Analysis, August 2026.
Who It's For
Any finance team that hands a balance sheet to a board, a lender, or an owner and then has to explain it. The standard report answers "what changed." This answers "where the money went, and whether that's a problem."
This prompt will be in the free tier of the Sonar AI Prompt Library in the next release. I'll post here when it's out.