Most financial analysis starts from the financial statements. You pull the income statement and the balance sheet, you compute the ratios, and you trust that the statements were built correctly.
Four prompts that I added to the Sonar AI Prompt Library in August start somewhere else: the raw, cumulative postings in the general ledger. They build the statements they need from those postings, prove them with tie-outs, and then do their work. I want to explain why that matters, and then walk through each of the four.
If you're new to this, Sonar AI is an AI agent that runs inside NetSuite. Every prompt in the library is a playbook that I engineered and tested against live NetSuite data, and you run it inside your own account, against your own records.
Why Start From Postings
A pre-built financial statement depends on how the account was configured. Account types, the fiscal calendar, the report layouts, and the period close status all shape what it shows, and none of that is visible in the numbers themselves.
A statement derived from postings can be proven. Assets have to equal liabilities plus equity. The change in retained earnings has to equal net income. When those tie out to the penny, the rest of the analysis has a foundation. When they don't, that's a finding, and the prompt reports it rather than working around it.
All four of these prompts share that design. The database does the aggregation in SuiteQL, the assembly math is done in code rather than by the model, and every number in the report traces back to a query that's printed in the appendix.
Operating Leverage
Your P&L tells you what you earned. It doesn't tell you what happens to profit when sales move one percent. That's the question this prompt answers.
It regresses monthly operating cost against monthly revenue over the full usable history of the ledger, splits the cost base into fixed and variable, and translates the split into the numbers that matter more than the current margin: breakeven revenue, contribution margin, degree of operating leverage, and margin of safety. SuiteQL doesn't support regression functions, so the fit is computed in the assembly step, with full statistics, and then validated with an independent bottom-up rebuild that classifies every cost account as fixed, mixed, or variable.
In the test account, the verdict fit on one page. About $368K a month in fixed cost, 48.8 cents of variable cost per revenue dollar, a breakeven of $719K a month, and a degree of operating leverage of 2.86. Every one percent move in sales moves operating profit about 2.9 percent, in both directions. The more interesting story was the trend: a year earlier, at lower revenue, the same cost structure produced a leverage of about 4.2 and a margin of safety of only 19 percent. Growth had been de-risking the P&L, and the report could show by how much.
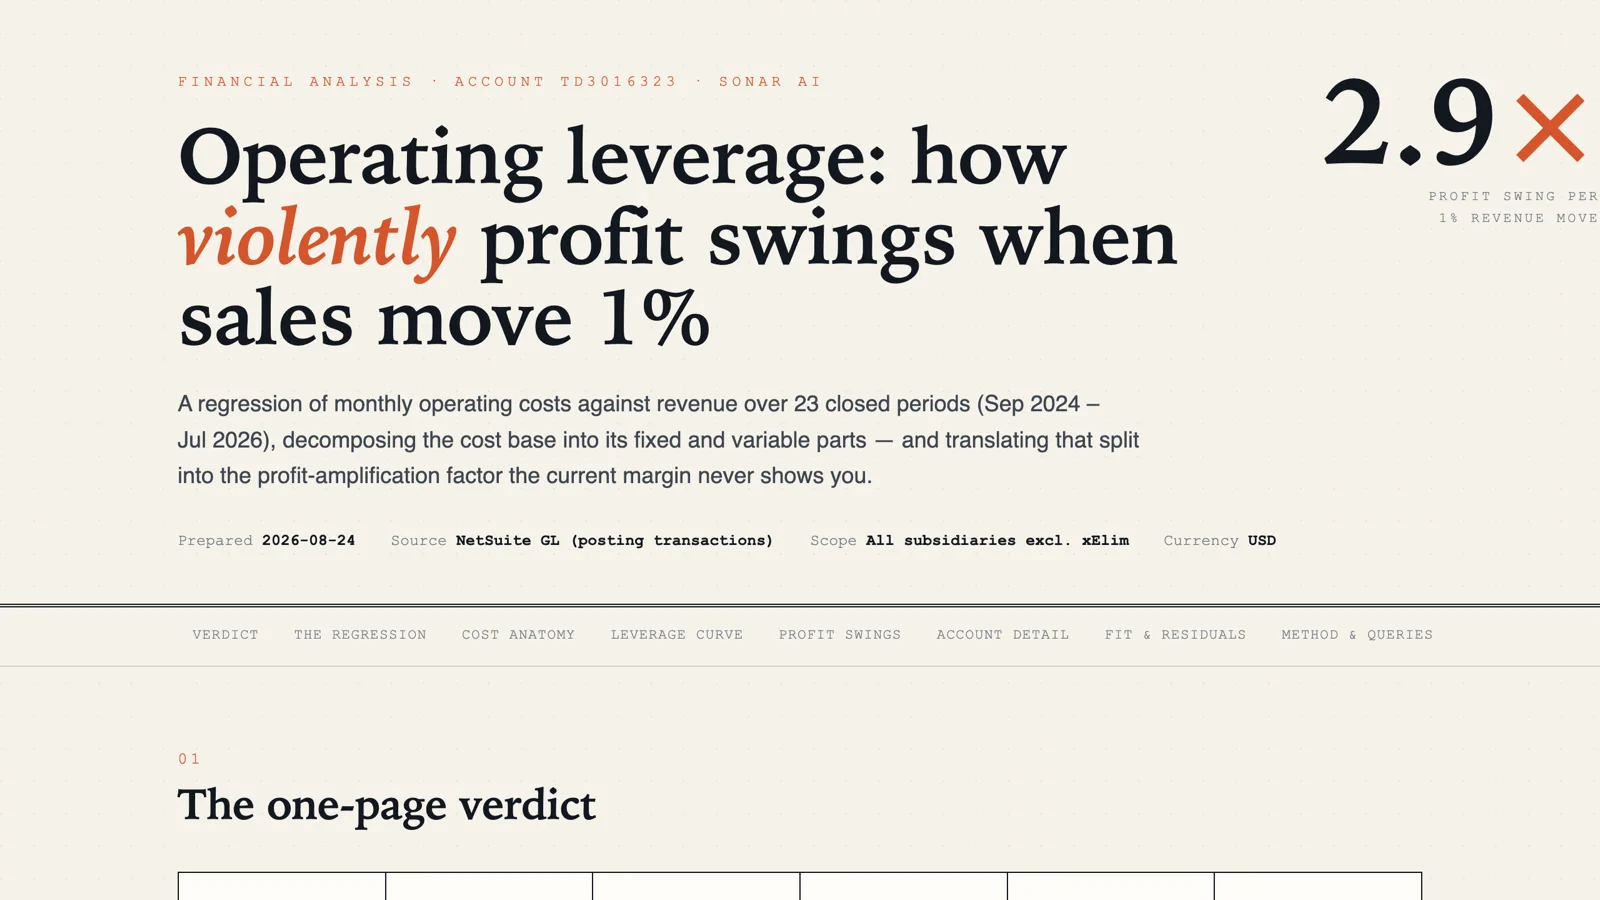
Sample report: Operating Leverage: Fixed and Variable Cost Analysis.
Composite Forensic Scores
The Beneish M-Score screens for earnings manipulation. The Altman Z-Score predicts bankruptcy risk within two years. They're two of the most respected models in forensic finance, and they normally require prepared statements and a spreadsheet full of ratios.
This prompt builds both comparative-period statements from the ledger, proves them with the tie-outs above, computes all eight Beneish indices and the private-firm variant of Altman, and shows every formula with its actual numbers. It also handles the degenerate ratios that a young ledger springs on the Beneish indices, which is a detail that's easy to get wrong.
The interesting part is when the two models disagree, and in the test account they did. Altman came back at 4.91, comfortably in the safe zone. Beneish came back at -0.44, well above the -1.78 threshold, driven by receivables growing much faster than sales and by high total accruals. Days sales outstanding had gone from 36 days to 64. Days inventory outstanding had doubled. Solvent, but with anomalous earnings quality. The report reconciles the two verdicts and hands you an ordered list of audit follow-ups, which is exactly what you want when the models point in different directions.
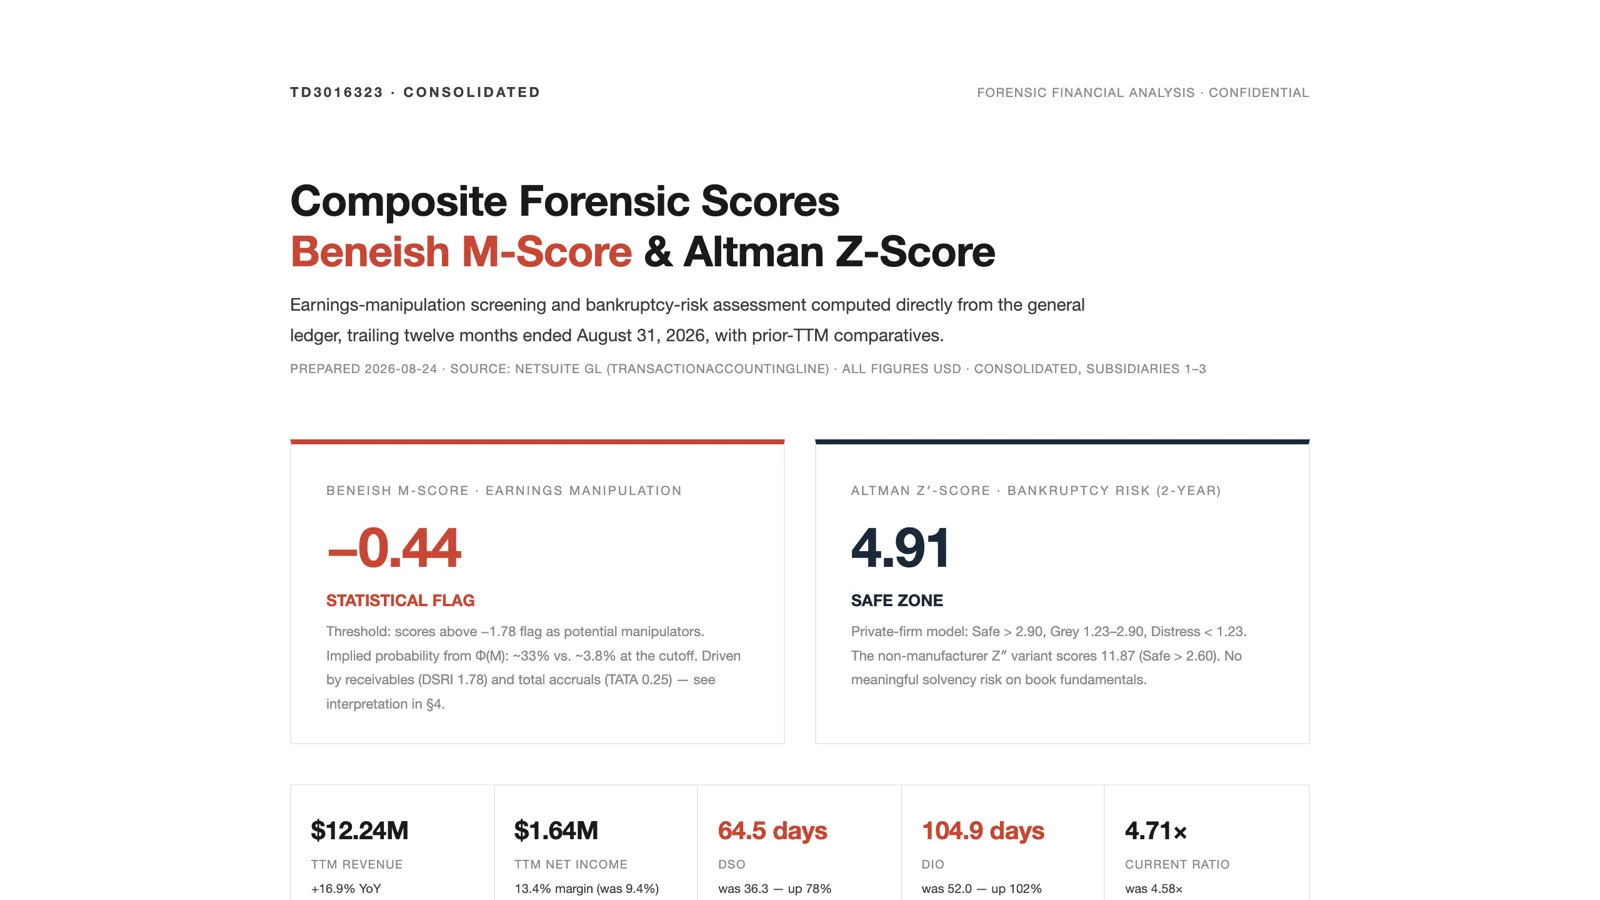
Sample report: Composite Forensic Scores: Beneish M-Score and Altman Z-Score.
Return on Incremental Invested Capital
Overall return on invested capital tells you whether you have a good business. Incremental return, ROIIC, answers the question that drives strategy: what is the last dollar you reinvested actually earning?
The prompt builds the invested-capital balance month by month from postings, chooses measurement windows from the data, runs a sensitivity across four definitions of invested capital, and then runs a counterfactual that I think is the real product. It asks what the capital build would have been if working-capital efficiency had held constant, and splits the difference into growth dollars and slippage dollars.
In the test account, the headline was healthy. Incremental ROIC of 36 percent, on $652K of additional operating profit against $1.81M of additional invested capital. Against any plausible cost of capital, the reinvested dollar was earning a multiple of its hurdle. But the marginal dollar was earning far less than the average dollar, and the decomposition showed why: the growth was self-funding, and roughly $2M of capital was tied up in receivables and inventory slippage instead. The report priced the fix, too. Returning days sales outstanding to 40 days would release about $820K.
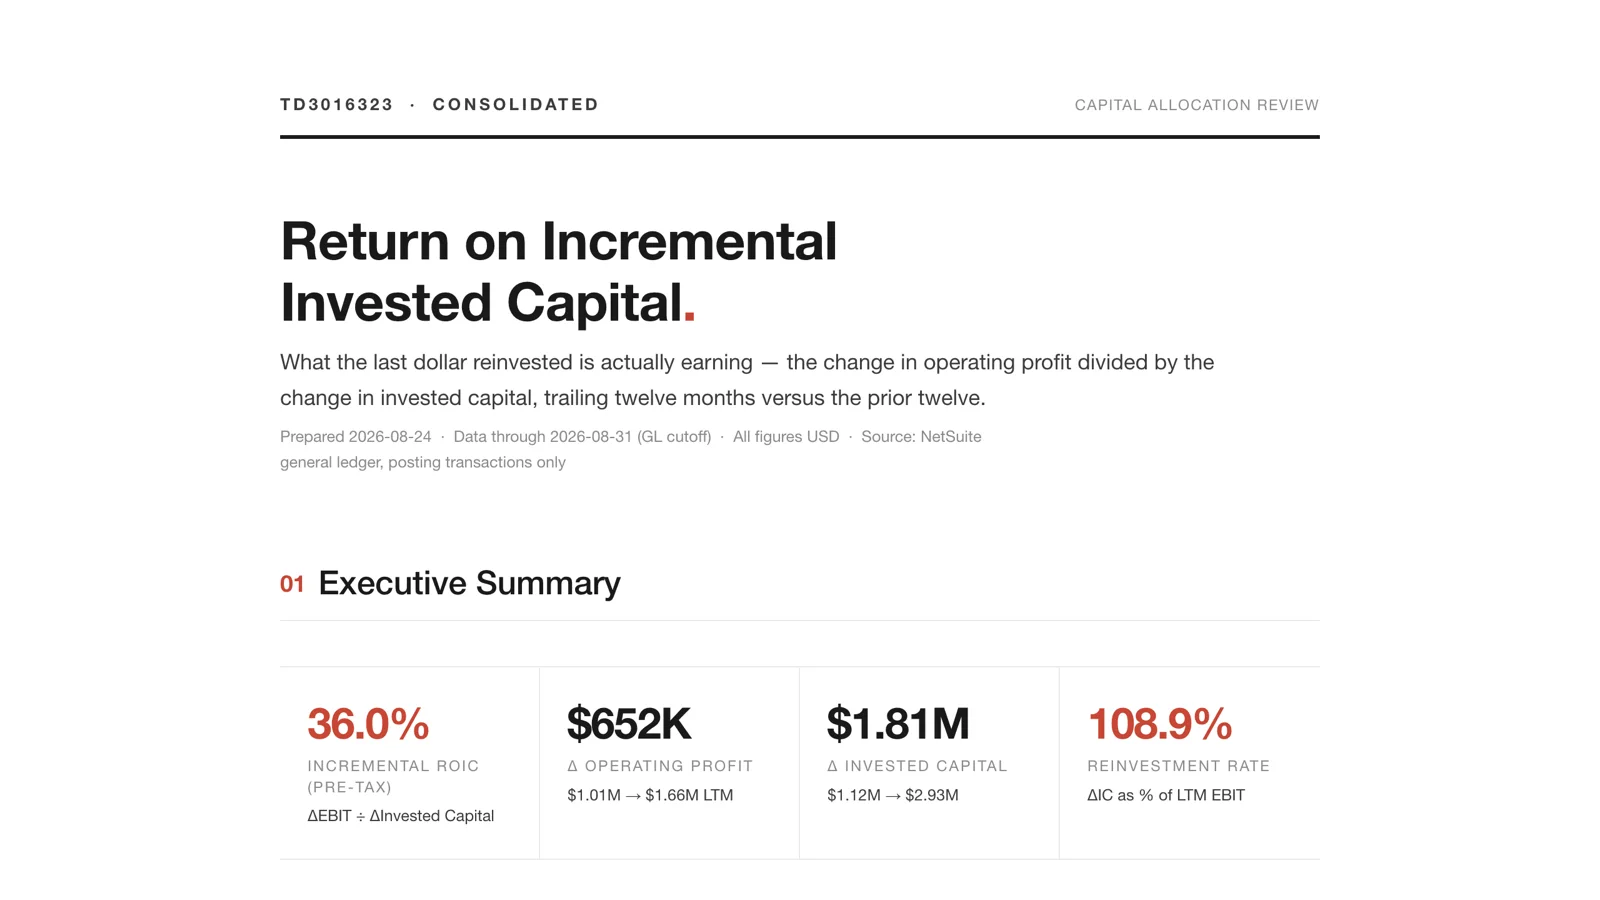
Sample report: Return on Incremental Invested Capital.
Capex vs. Depreciation
Here's a question that most financial statements won't answer directly: is the company reinvesting enough to sustain its asset base, or quietly consuming it to make free cash flow look better than it is? When capital spending runs below depreciation for years, free cash flow looks great, right up until the deferred-replacement bill arrives.
This prompt maps the fixed-asset side of the chart of accounts from the live account, buckets every posting into capex or depreciation, and computes coverage at annual and cumulative horizons. Because the populations are small, it audits every underlying line individually, and that's where the findings live. It also cross-checks the ledger against the fixed-asset subledger and scales the result against revenue.
In the test account, the first twenty months of history showed steady depreciation and exactly zero capital purchases: the textbook pattern of an eroding asset base. A reinvestment cycle in mid-2026 lifted the annual ratio to 1.67, but lifetime capex still covered only 0.60 of lifetime depreciation. The more consequential finding was one of scale. A business with two stores, two distribution centers, and light manufacturing was running on effectively no capitalized asset base, at a capex intensity of 0.14 percent of revenue where peers run two to five. Either the assets are leased and expensed, or they're under-capitalized on the books. The line-level audit also caught a depreciation entry misclassified to other expenses, which was understating EBITDA, and a fixed-asset register that covered only half of the capex in the ledger.
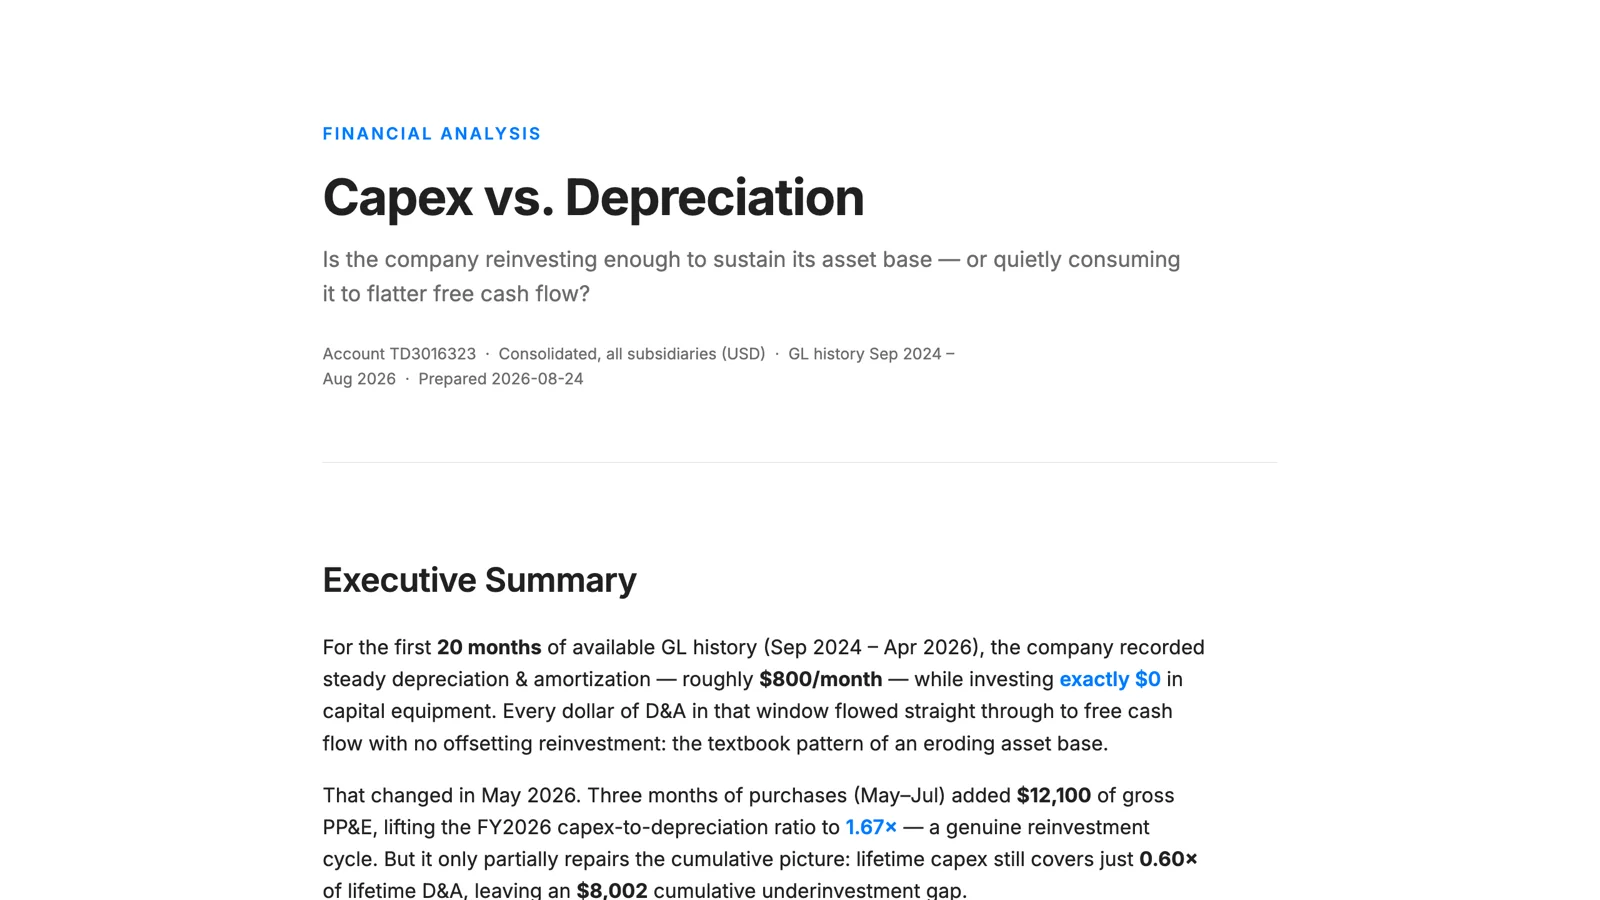
Sample report: Capex vs. Depreciation: Asset-Base Sustainability.
Wrapping Up
None of these analyses is new. What's new is that they can be run inside NetSuite, against live data, without exporting anything, and that the statements they depend on are built and proven in the same pass. The tie-outs are the point. When an analysis can prove its own inputs, the conversation moves from "is this number right" to "what do we do about it," and that's the conversation worth having.
All four are in the paid tier of the Sonar AI Prompt Library. Look for Operating Leverage Analysis, Composite Forensic Scores, Return on Incremental Invested Capital, and Capex vs. Depreciation.