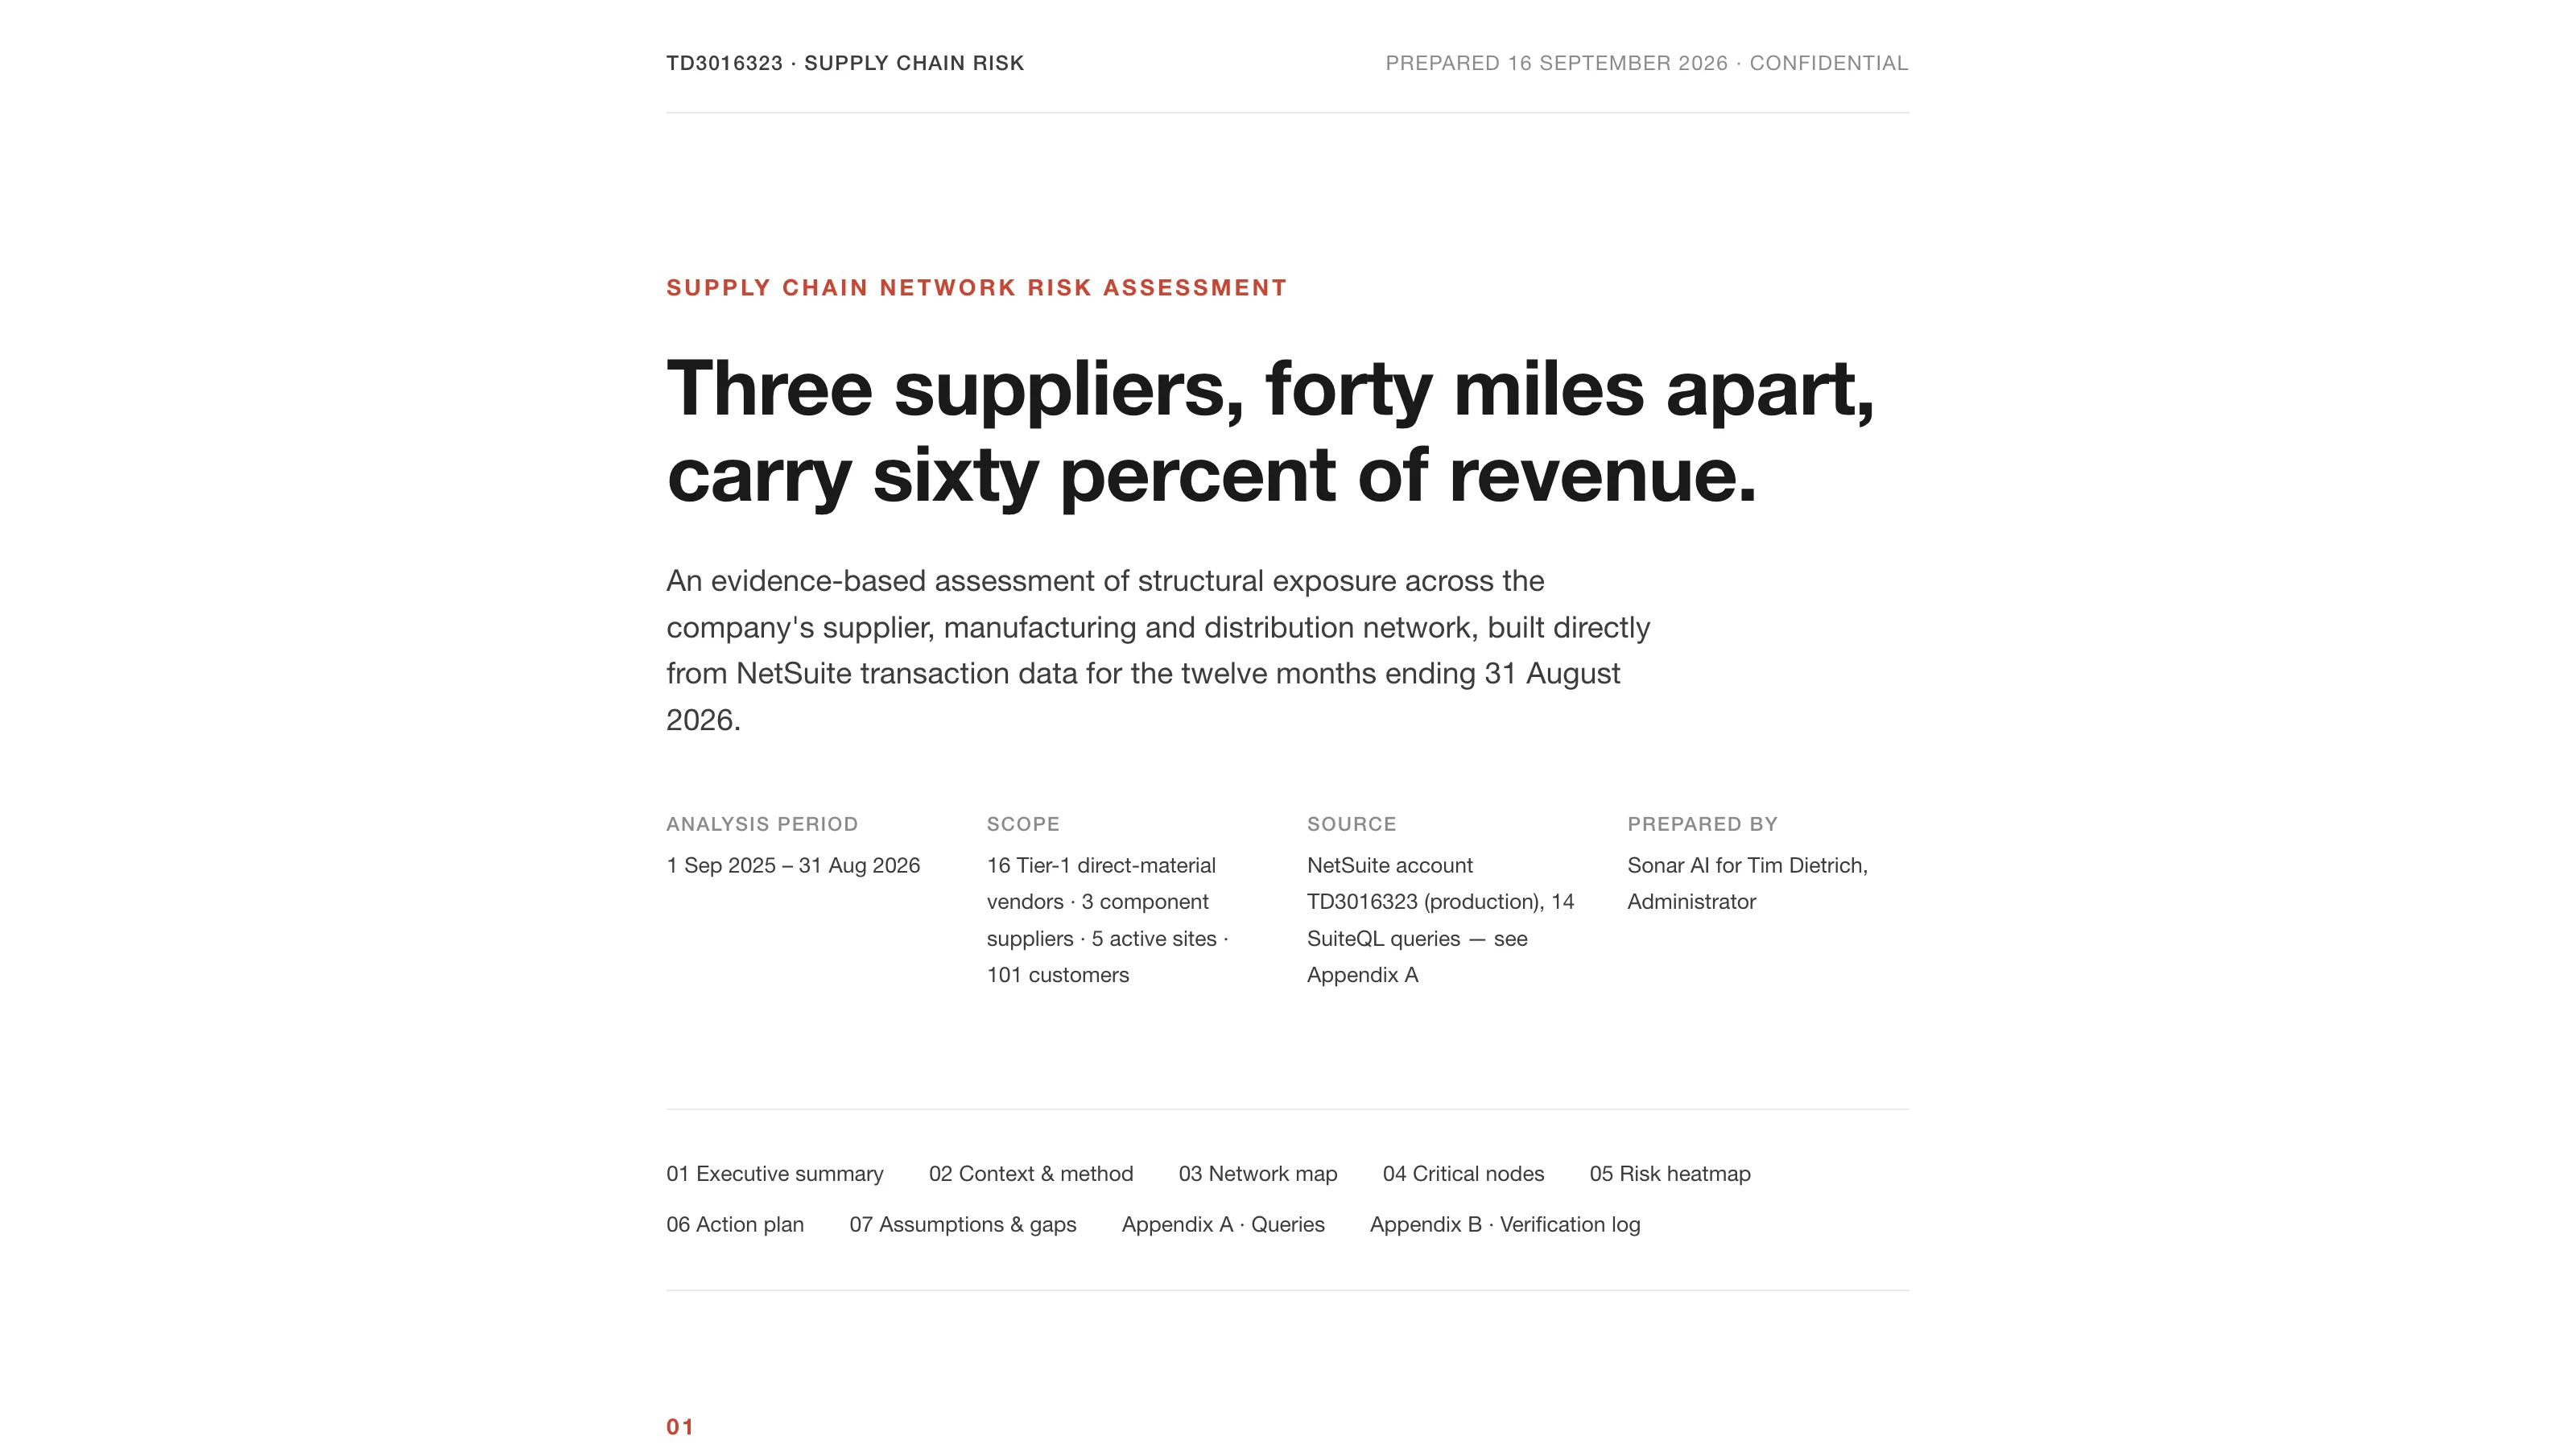
Three suppliers within about forty miles of each other carry sixty percent of my NetSuite test account's product revenue. They sit on the Hayward and San Andreas fault system, and 59% of the inventory that's meant to buffer their loss sits in California with them.
The Supply Chain Network Risk Assessment rebuilds the supplier-to-site-to-customer network from actual flows in NetSuite rather than from the vendor list, scores every supplier on likelihood and impact, and says which risks inventory can cover and which it can't. It went into the Sonar AI Prompt Library in September. If you're new to this, Sonar AI is an AI agent that runs inside NetSuite. Every prompt in the library is a playbook that I engineered and tested against live NetSuite data, and you run it inside your own account, against your own records. Nothing leaves the account, and nothing is written to it.
Built From Flows
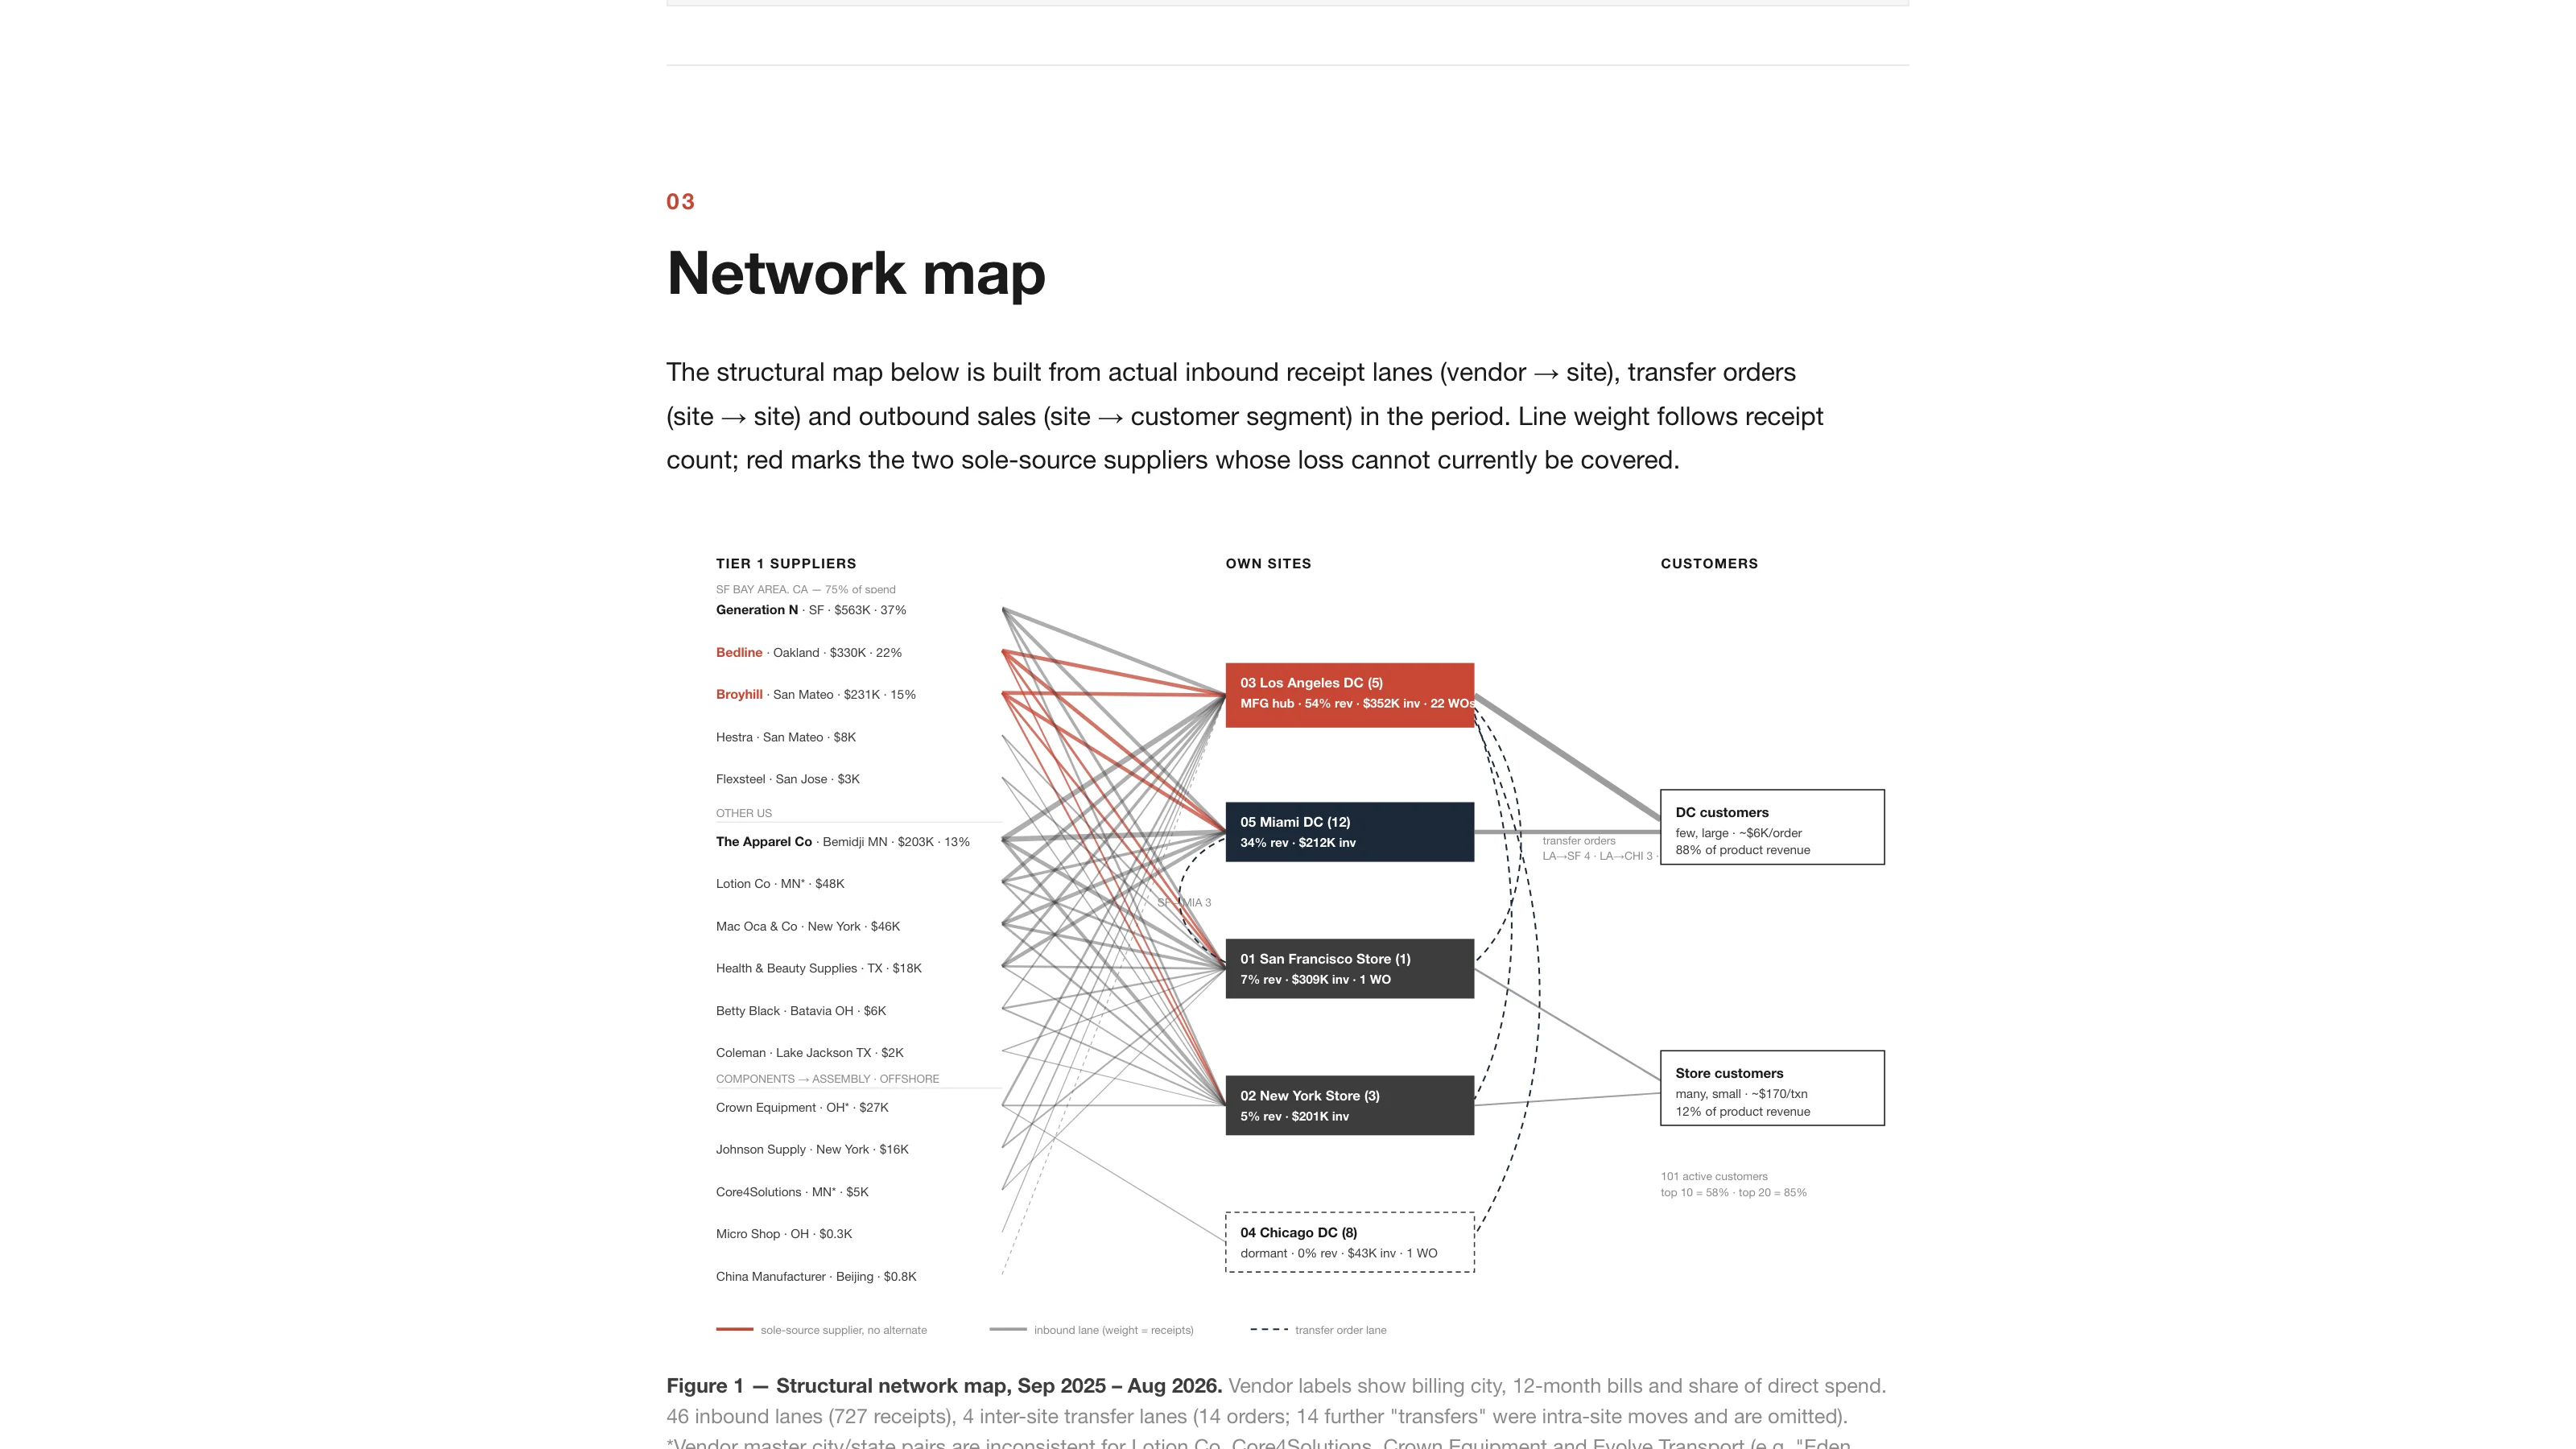
The network map is drawn from receipt lanes, transfer orders, and outbound sales over twelve months: 46 inbound lanes carrying 727 receipts, four inter-site transfer lanes, and outbound flow to two customer segments. Line weight follows receipt count. Two suppliers are drawn in red, because their loss can't currently be covered.
Bedline, in Oakland, is the sole source for all thirteen mattress and box-spring SKUs, which are 28% of product revenue, and no alternate exists for any of them. Broyhill, in San Mateo, is the sole source for nine of ten Estes Park casegoods, 18% of revenue, with Flexsteel as a paper alternate on adjacent lines only. Add Generation N in San Francisco and the Bay Area cluster is 75% of direct spend. The single Los Angeles distribution center ships 54% of revenue, runs 22 of 24 work orders, and is the origin of every transfer lane.
The report's framing of the exposure is what I'd want a board to hear. The exposure goes beyond any one supplier failing. A single regional event, an earthquake, wildfire smoke, a port disruption, would interrupt three of the four largest vendors and most of the buffer inventory at the same time.
The Instrumentation Is Blind
Then the report says something that most supply-chain analyses skip. Delivery performance on paper is excellent, and the data can't support that conclusion. Of 378 received purchase orders, 373 carry a receipt date identical to the order date. Expected receipt dates are mostly null, vendor lead times are empty, and one Bedline receipt precedes its purchase order by 31 days. So lead time, on-time delivery, and fill rate can't be trusted until the dating is fixed, and the report treats that as a top-five risk in its own right.
It follows through in the scoring. The heatmap combines three likelihood dimensions with explicit weights and scores impact separately so the two are never conflated. Delivery performance, normally weighted above 50%, is capped at 40% because the signal barely discriminates on this account. Geography is raised to 35% because physical clustering is the dominant real-world exposure. Geopolitical is 25% and near-uniform, since fifteen of sixteen vendors are domestic, and the report says the upstream sourcing of the furniture and apparel is unverifiable from NetSuite. The priority zone contains Bedline, Broyhill, and Generation N. The highest-likelihood node in the whole network is the one offshore vendor, and it's immaterial at $750 of spend.
The Healthy Pattern, and the Unused Hedge
The beauty category is the template. Three suppliers cross-source every item between them, with zero single-source SKUs and four sites each, and the report says the furniture lines should follow it.
The assembly line is the opposite. All 24 purchased bill-of-materials components have exactly one vendor, the chain is three levels deep, and a single late shipment from either of the two component suppliers stalls all three levels. Those two suppliers are also the only vendors with observed delivery misses.
And the Chicago distribution center is the hedge nobody is using. It holds $43K of stock, receives components and transfers from Los Angeles, has already built one work order, and shipped nothing in twelve months.
Ten Actions, Two That Matter Most
The plan is ordered by risk reduction per unit of effort, with a KPI for each. The quick wins are data and configuration: mandatory expected-receipt dates, real receipt dating, vendor lead times, clean addresses, and a monthly on-time-in-full scorecard starting with the two erratic component suppliers. There's also a reconciliation to run on Generation N, which billed $563K against $187K of purchase orders, a gap the report can't explain from the record.
The medium-term items are to extend Flexsteel to the Estes Park casegoods with trial orders, and to rebalance inventory by releasing Generation N's 1,344 days of cover into safety stock for Bedline and Broyhill items at Miami and Chicago. The strategic items are a second mattress source outside California and activating Chicago as a second assembly site.
If only two things get done, the report says, then it should be the rebalancing and the second mattress source. Rebalancing buys time against a Bay Area event at no net working-capital cost. A second source is the only permanent fix for the largest single exposure in the network.
The Verification Log
Appendix B lists claims that were tested against the account after the initial analysis and what changed. The first draft said seven components had no vendor at all. The verification query showed that all 24 have exactly one, and the initial reading came from a truncated result set, so the exposure was corrected from unsourced to fully single-sourced. A component was attributed to the wrong supplier and corrected. $683K of revenue with no fulfillment location turned out to be 27 test invoices and was excluded. And the zero lead times were confirmed and reclassified as a data gap rather than performance.
Fourteen SuiteQL queries are in Appendix A with row counts, and the key derived figures table shows where each headline number came from.
Wrapping Up
This is the first of four inventory prompts in the release that are meant to run in sequence. The demand forecast sizes the buffers this report says to rebalance, and the replenishment review measures the supplier lead times this report says can't be measured yet, once the dating is fixed.
Supply Chain Network Risk Assessment is in the paid tier of the library. The full sample report from the test account is online, and I covered the whole September release in a separate post.
Your vendor list says you're diversified. Your transactions might disagree, and on this account the disagreement was forty miles wide.