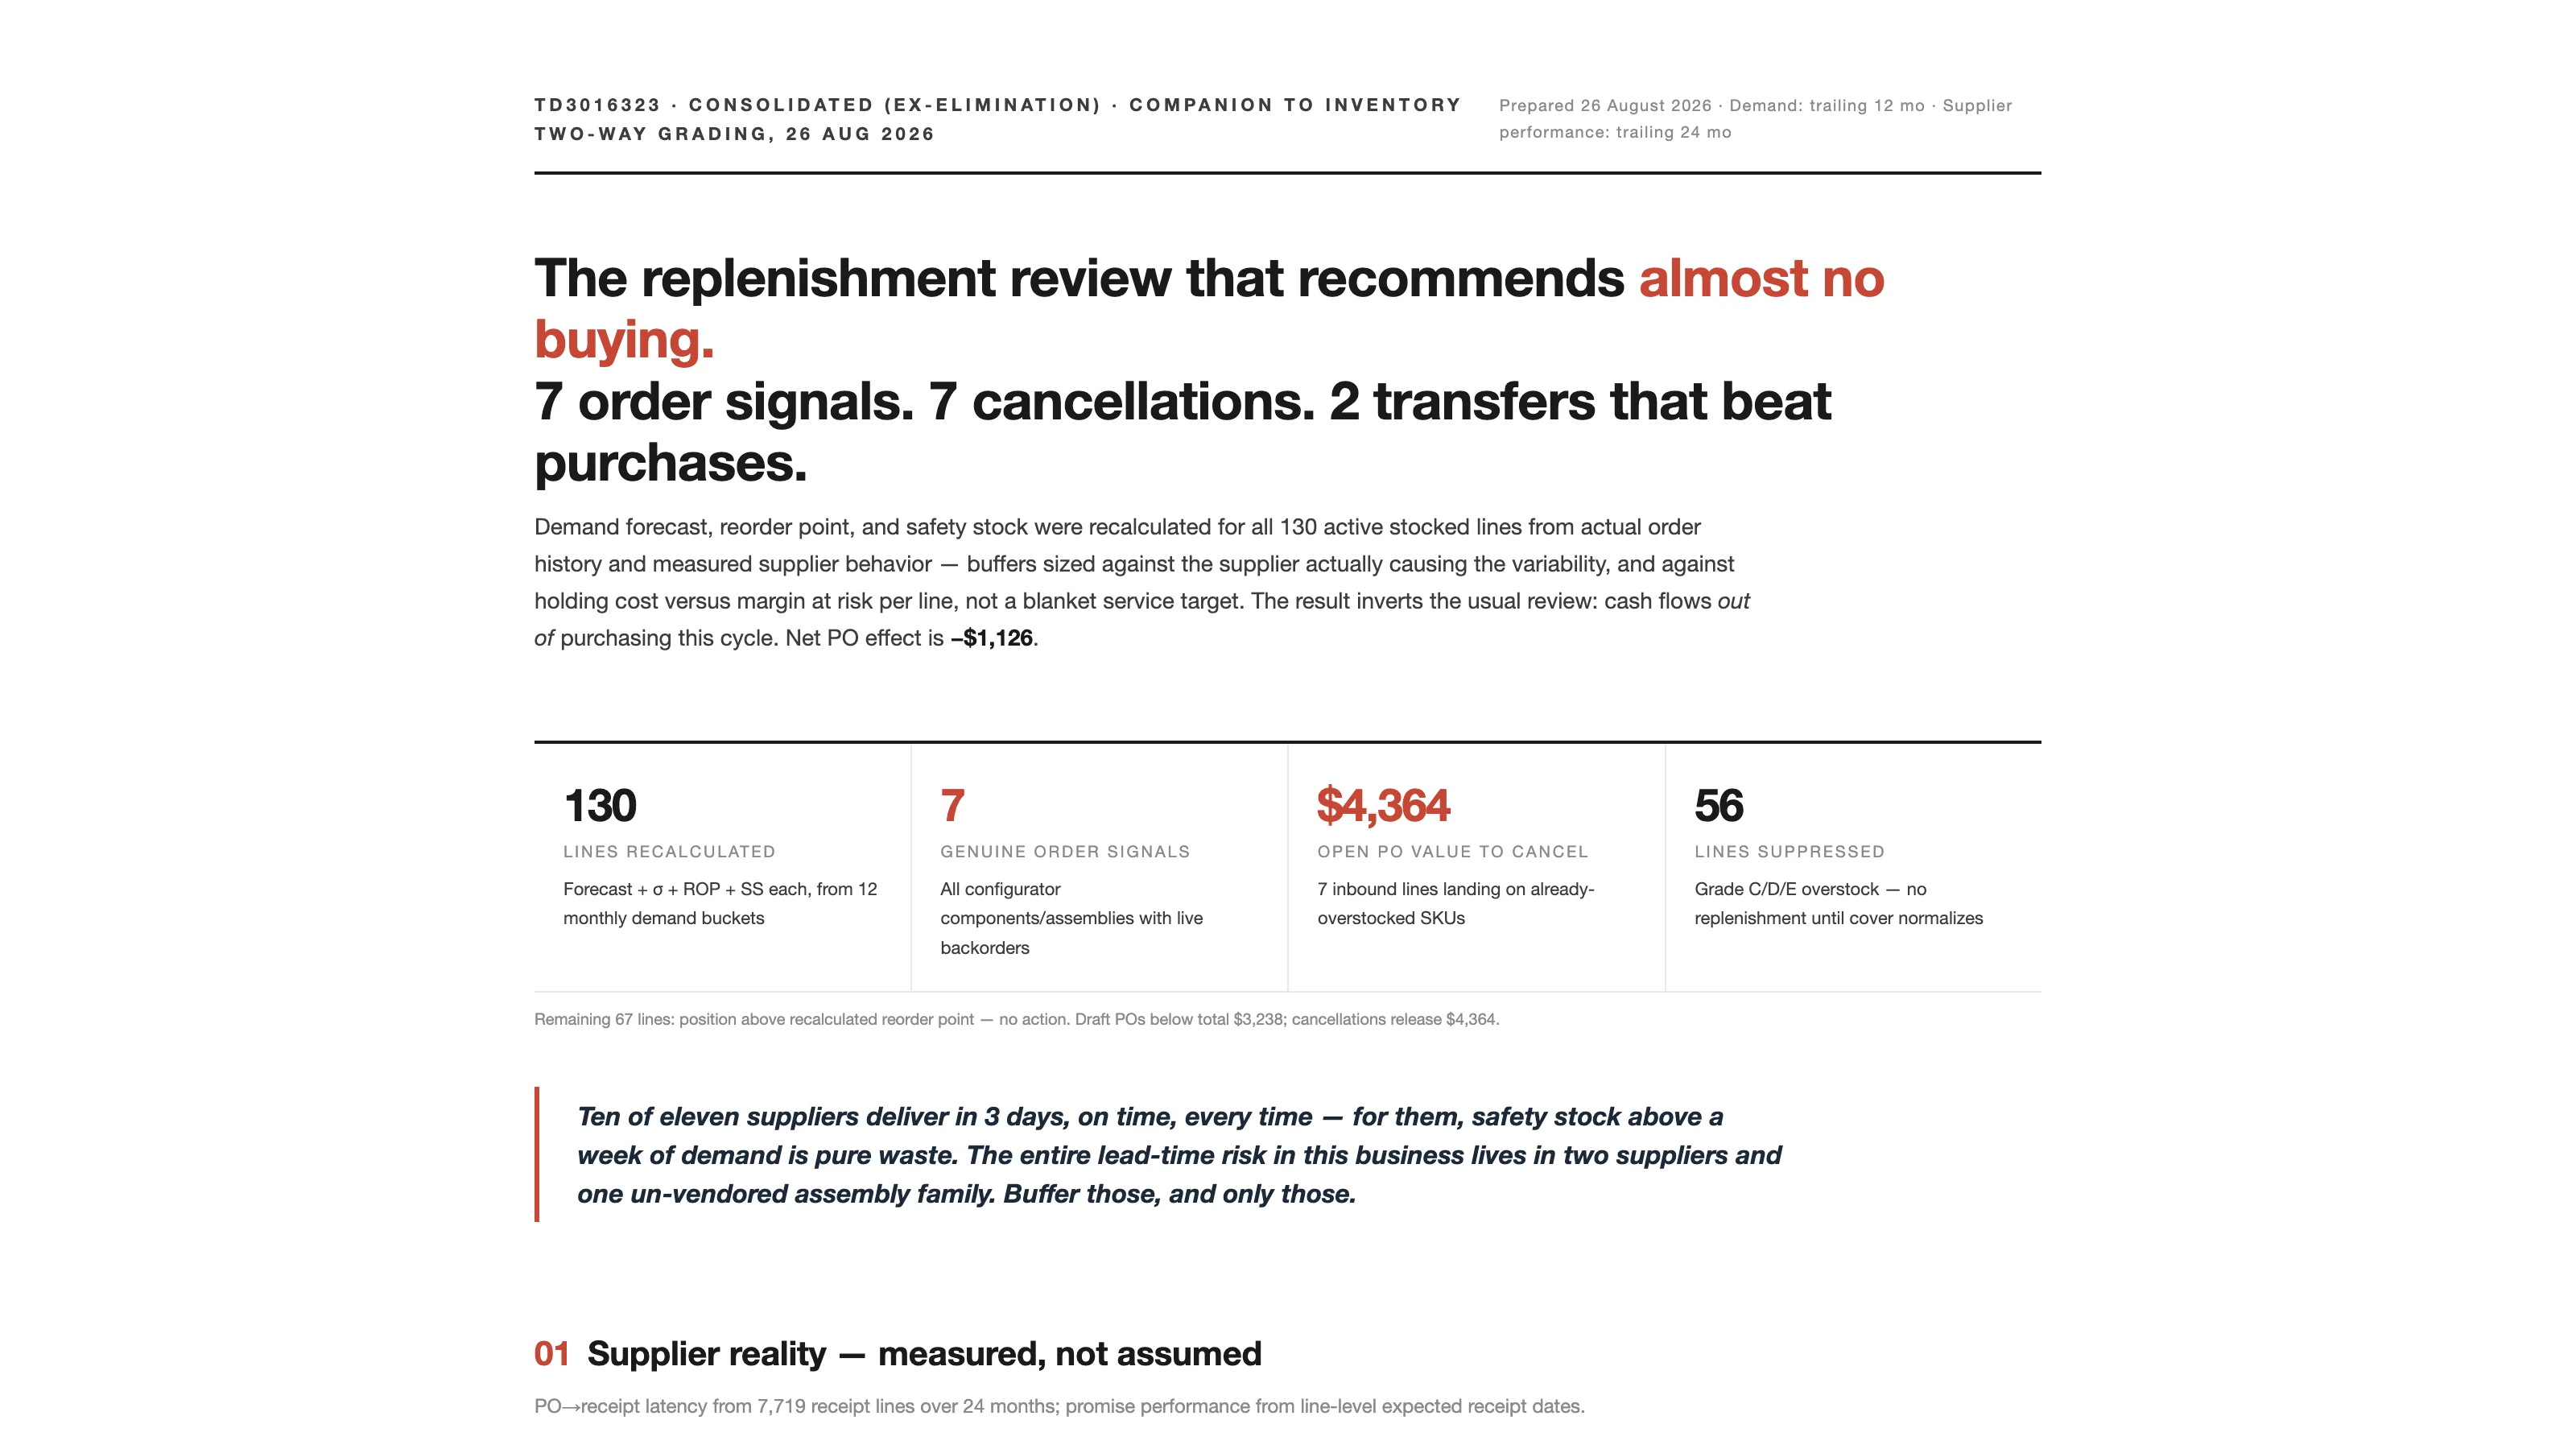
Ten of the eleven suppliers on my NetSuite test account deliver in three days, on time, every time. The entire lead-time risk in the business lives in the other two, and those two feed exactly the component families that are on backorder.
That's the finding that reorganizes the whole replenishment review. Replenishment Engineering recalculates the forecast, reorder point, and safety stock for every stocked line from actual order history and measured supplier behavior, and on this account the review recommends almost no buying. Seven order signals, seven cancellations, two transfers that beat purchases. It went into the Sonar AI Prompt Library in September. If you're new to this, Sonar AI is an AI agent that runs inside NetSuite. Every prompt in the library is a playbook that I engineered and tested against live NetSuite data, and you run it inside your own account, against your own records. Nothing leaves the account, and nothing is written to it.
Supplier Reality, Measured
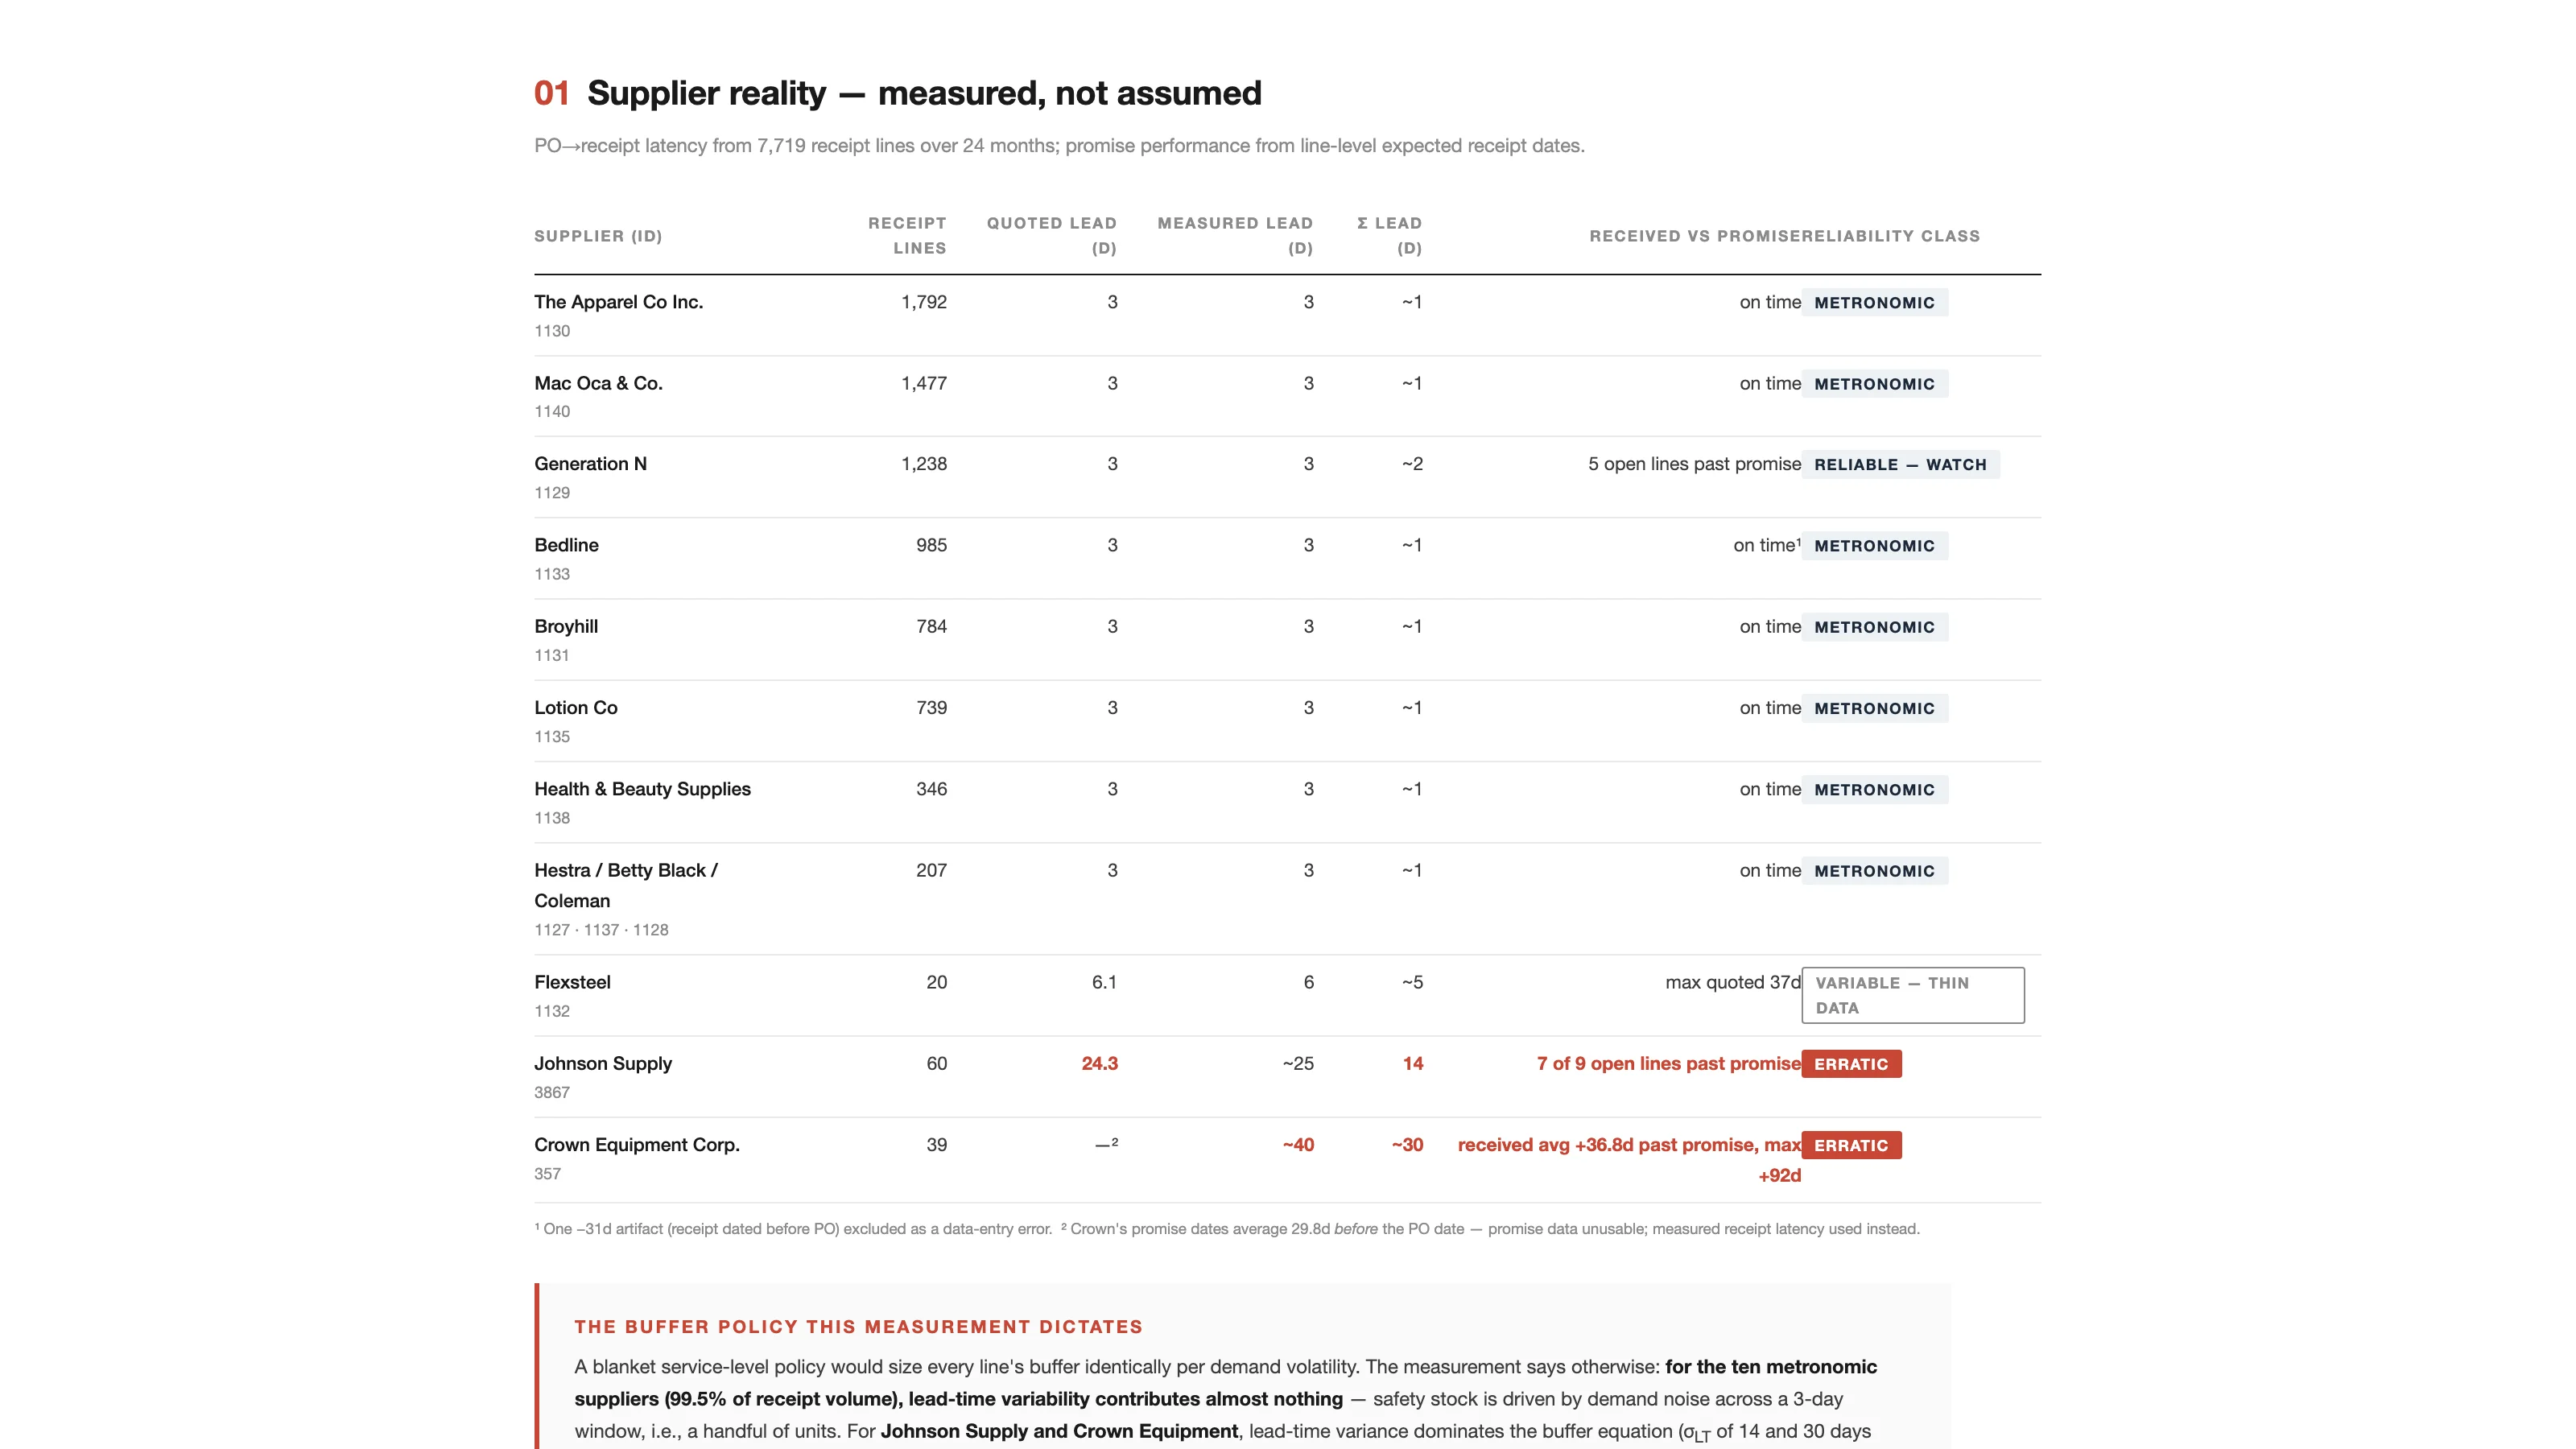
The first table is supplier lead time from 7,719 receipt lines over 24 months, with the quoted lead beside the measured one. Ten suppliers, 99.5% of receipt volume, measure at three days with a standard deviation of about one, and the report classifies them as metronomic. Johnson Supply quotes 24 days, measures about 25, with a standard deviation of 14, and has seven of nine open lines past promise. Crown Equipment's promise dates average 29.8 days before the purchase-order date, which is physically impossible, so the report discards the promise data as a data-entry inversion and uses measured receipt latency instead: about 40 days, plus or minus 30.
The buffer policy follows from the measurement. For the ten metronomic suppliers, lead-time variability contributes almost nothing, and safety stock is a handful of units driven by demand noise over a three-day window. For the two erratic suppliers, lead-time variance dominates the buffer equation. The report puts it in one sentence: the stockouts and the erratic suppliers are the same story.
Service Level Is Priced Per Line
There's no blanket service target anywhere in the review. Each line's service level comes from its own economics through the newsvendor critical ratio: unit gross profit at risk against the holding cost over one exposure period. A backpack at a 33% margin earns a safety factor of about 1.3. A $400 mattress at 55% earns about 2.0. High-margin lines with metronomic suppliers land at 97% to 99% implied service, and low-margin lines earn less. Nobody gets 95% because a policy said so.
The model table shows every formula. One footnote I enjoyed: this instance's SuiteQL rejects the standard-deviation function, so every sigma was computed from the average and the average of squares, exact rather than approximated.
Transfers Before Purchases, Cancellations Before Both
Every shortage was checked against surplus at sister sites before any purchase order was drafted. Two clear internally. A hand wash is backordered at the San Francisco store while the Los Angeles distribution center holds 92 available against its own reorder point of 10, so a transfer of 30 covers it and avoids a $540 purchase. The Estes Park Chair has open order lines aged up to 82 days at San Francisco with one unit available while Los Angeles holds 23, so a transfer of six covers it and avoids $1,845. The report notes that the chair is grade-C overstocked in aggregate, so this is reallocation rather than replenishment, and that its 2.7% margin is still flagged for pricing review before anyone invests in it again.
Then it looks at inbound purchase orders. Seven open lines are landing on SKUs already graded C, D, or E in the overstock review run the same day, including forty hoodies against 140 on hand and 98 a year of demand, and components with 33 months of cover. Receiving them deepens the surplus. Cancelling them releases $4,364.
Two Draft Purchase Orders, With Evidence
Only the shortages that survive the transfer check and the suppression screen earn a purchase order. There are two, both for assembly components, both from the erratic suppliers, totaling $2,748. Each draft carries its demand signal, its position, its lead-time assumption, its sizing arithmetic, its cash effect, and the margin at risk if it isn't placed. The Johnson Supply draft nets out the ten units already inbound so nothing is counted twice, and uses the measured 24-day lead time rather than the three days quoted on old orders. The Crown draft notes that with a 40-day supplier plus or minus 30, waiting for the next review cycle risks a quarter of blocked builds. One blocked assembly, the report says, repays the purchase order tenfold.
The assemblies themselves have no vendor record, because they're built rather than bought, so the review routes them to work orders against the component stock the two drafts protect.
The net cash effect is positive. Cancellations release $4,364. The two drafts consume $2,748. The review pays for itself before a single markdown.
Installing First Numbers
The section I'd want a NetSuite administrator to read is the one on what changed versus the standing setup. Across all 568 item-location rows, reorder points and preferred stock levels are blank on effectively every line. NetSuite hasn't been generating demand-driven supply signals at all, and replenishment has been manual and rhythm-based, which explains both the leather-goods overstock, bought to rhythm rather than demand, and the component backorders, where no reorder point existed to trip. The recalculated values are ready to enter per location, and the report says that the account moves from zero planning parameters to measured ones either way.
The standing recommendations: enter the parameters for the 67 lines that are correctly stocked today, keep the 56 suppressed lines out of auto-replenishment until the clearance program burns cover below twelve months, put the two erratic suppliers on a promise-date compliance program, re-run quarterly, and assign vendors or confirm build-only status for the assembly family so future reviews route them automatically.
Wrapping Up
This is the fourth inventory prompt in the release and the one that turns the other three into purchase orders. It reads the grades from Inventory Two-Way Grading to know what to suppress, and it measures the lead times that the demand forecast had to assume.
Replenishment Engineering is in the paid tier of the library. The full sample report from the test account is online, and I covered the whole September release in a separate post.
Your suppliers don't deliver on your policy's lead time. They deliver on their own, and on this account the review could tell which two.