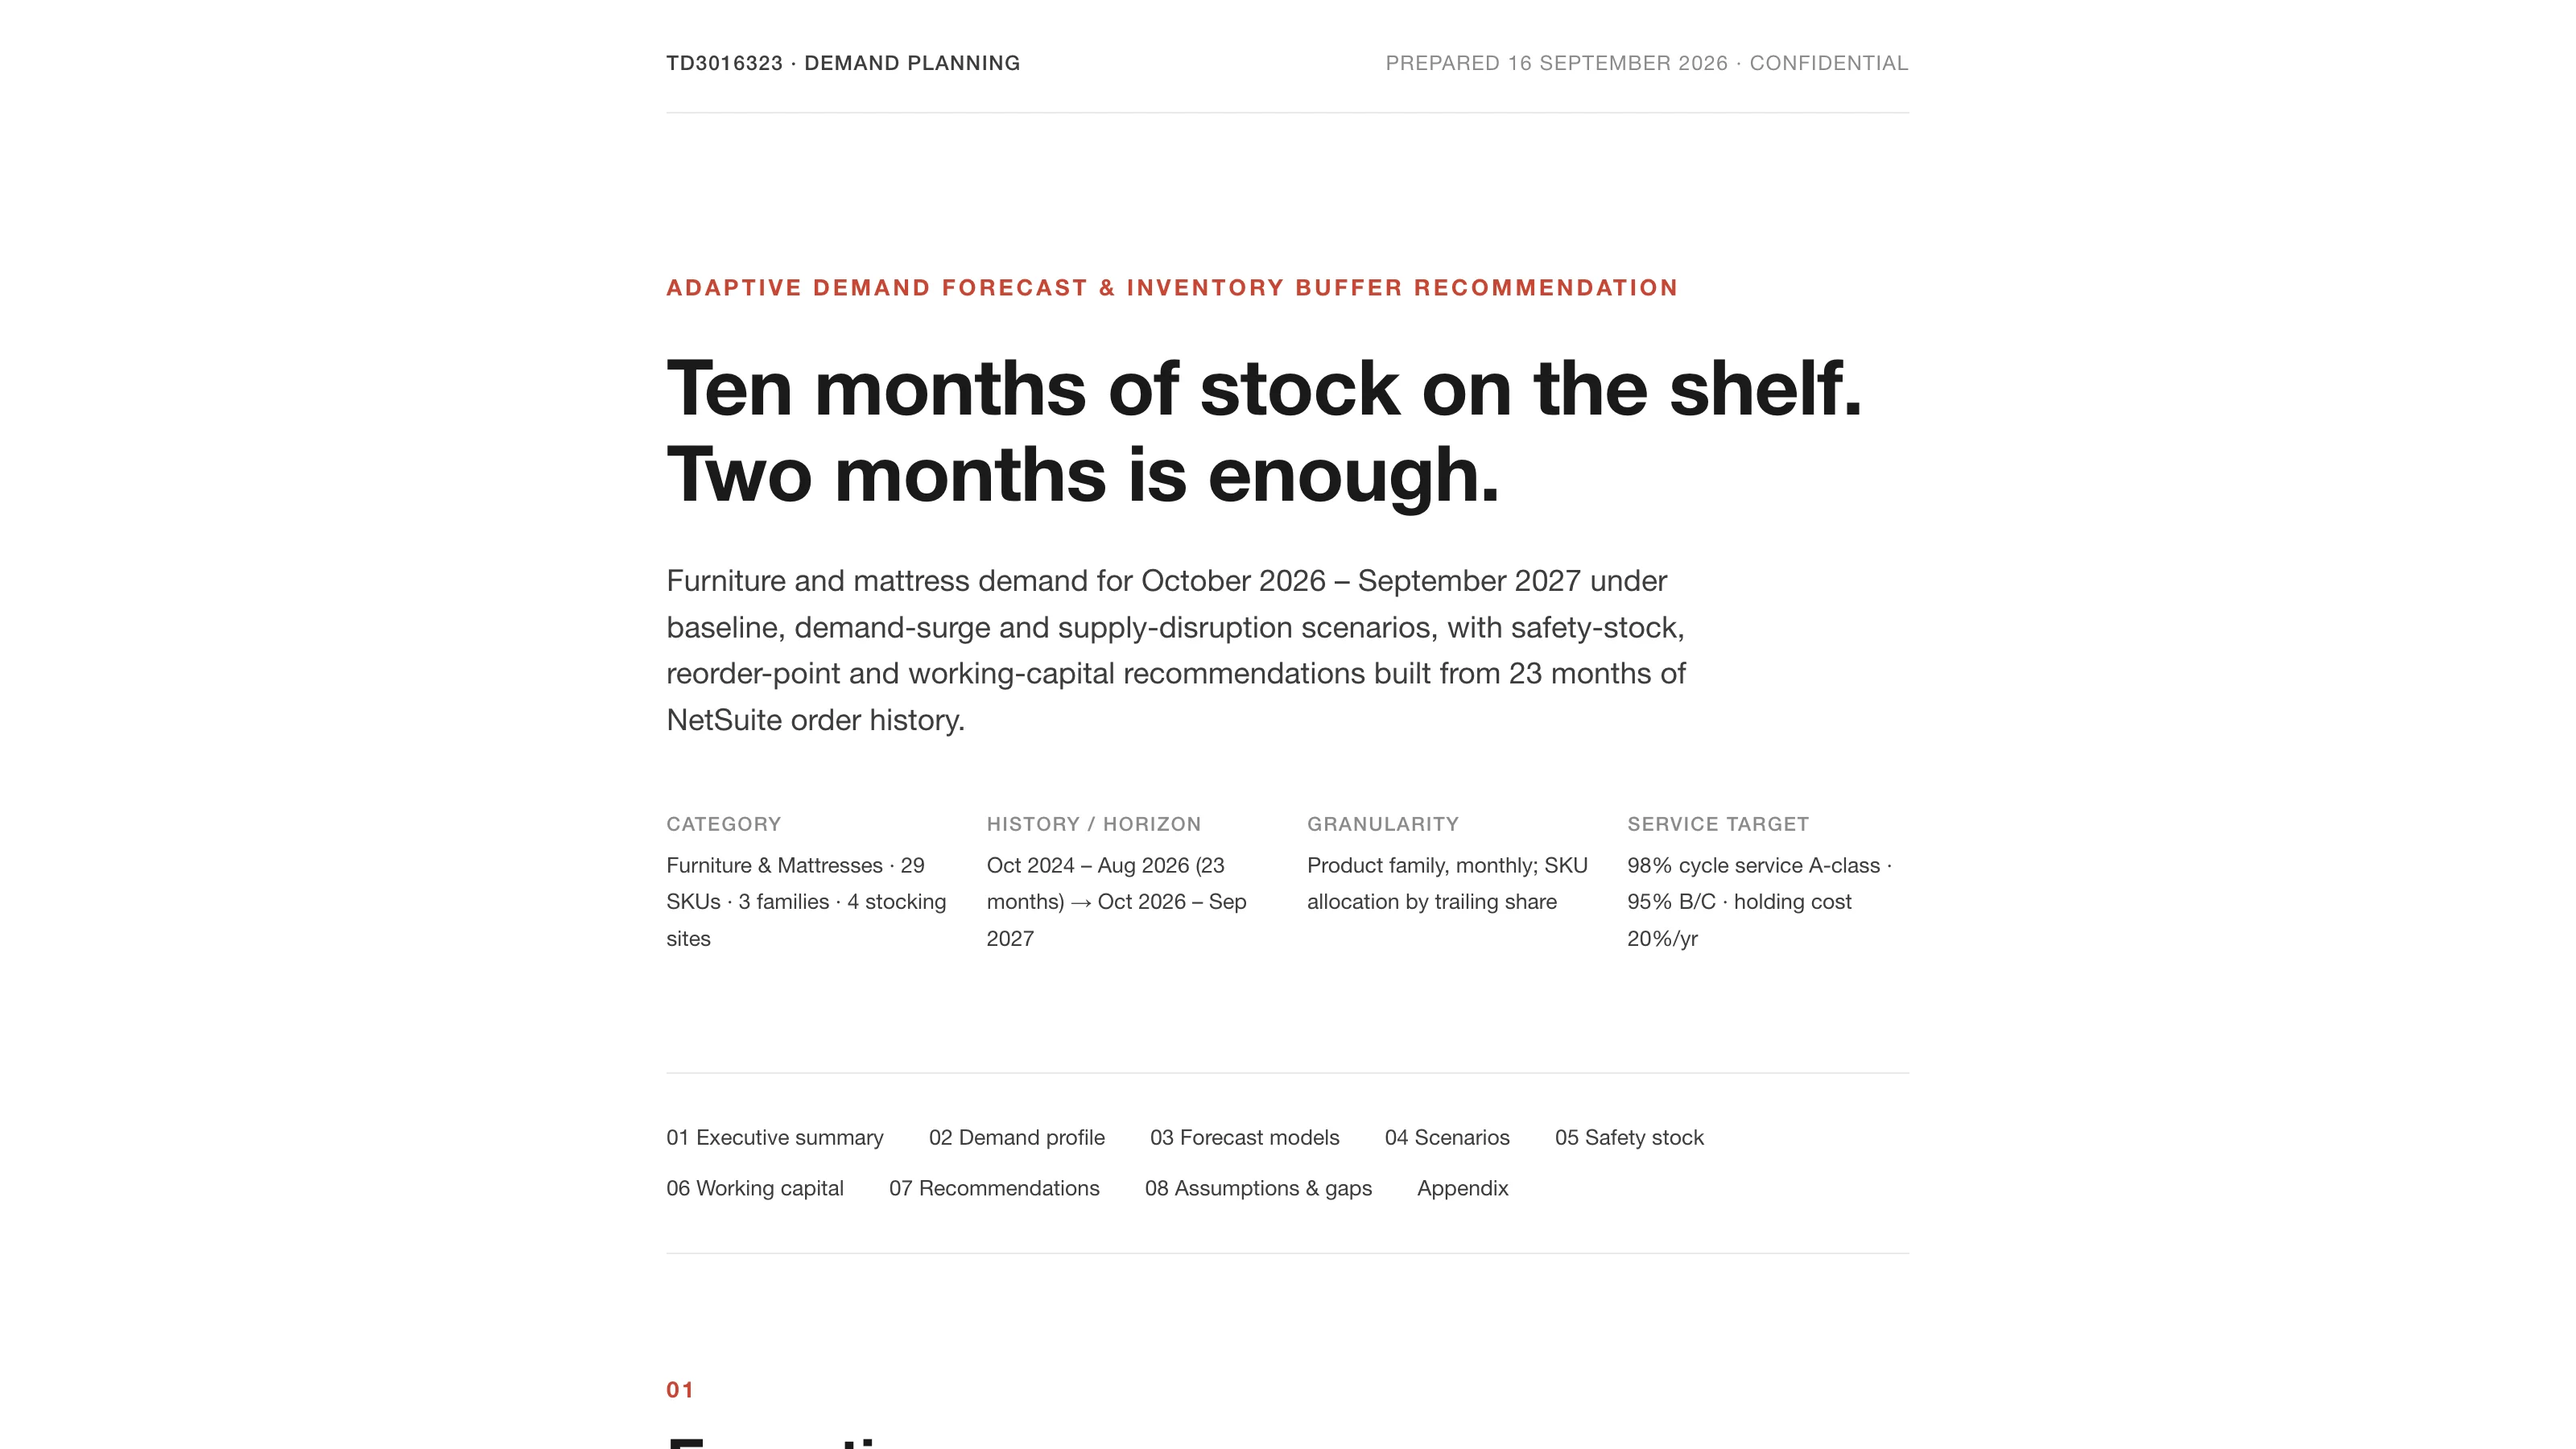
The furniture and mattress category on my NetSuite test account holds 316 days of supply. A statistically defensible buffer at 95% to 98% service needs about sixty. The difference, at cost, is $221K of working capital.
The Adaptive Demand Forecast and Inventory Buffer Planner gets to that number by fitting five forecasting methods per product family, printing the losers next to the winner, and then pricing each service level in holding cost, lost margin, and capital. It went into the Sonar AI Prompt Library in September. If you're new to this, Sonar AI is an AI agent that runs inside NetSuite. Every prompt in the library is a playbook that I engineered and tested against live NetSuite data, and you run it inside your own account, against your own records. Nothing leaves the account, and nothing is written to it.
Forecast at the Family, Allocate to the SKU
Twenty-nine SKUs in three families, each family mapping to one supplier, with 23 months of order history. The report segments them first: sixteen A-class SKUs by value, and eleven of those are Z-class by volatility, which is the segment where safety stock earns its keep and where the forecast has to carry the SKU. Family-level coefficient of variation runs from 0.27 to 0.72. SKU-level runs from 0.7 to 1.3. The category is stable in aggregate and lumpy in detail, which the report calls the classic case for forecasting at family level and allocating to SKU by trailing share.
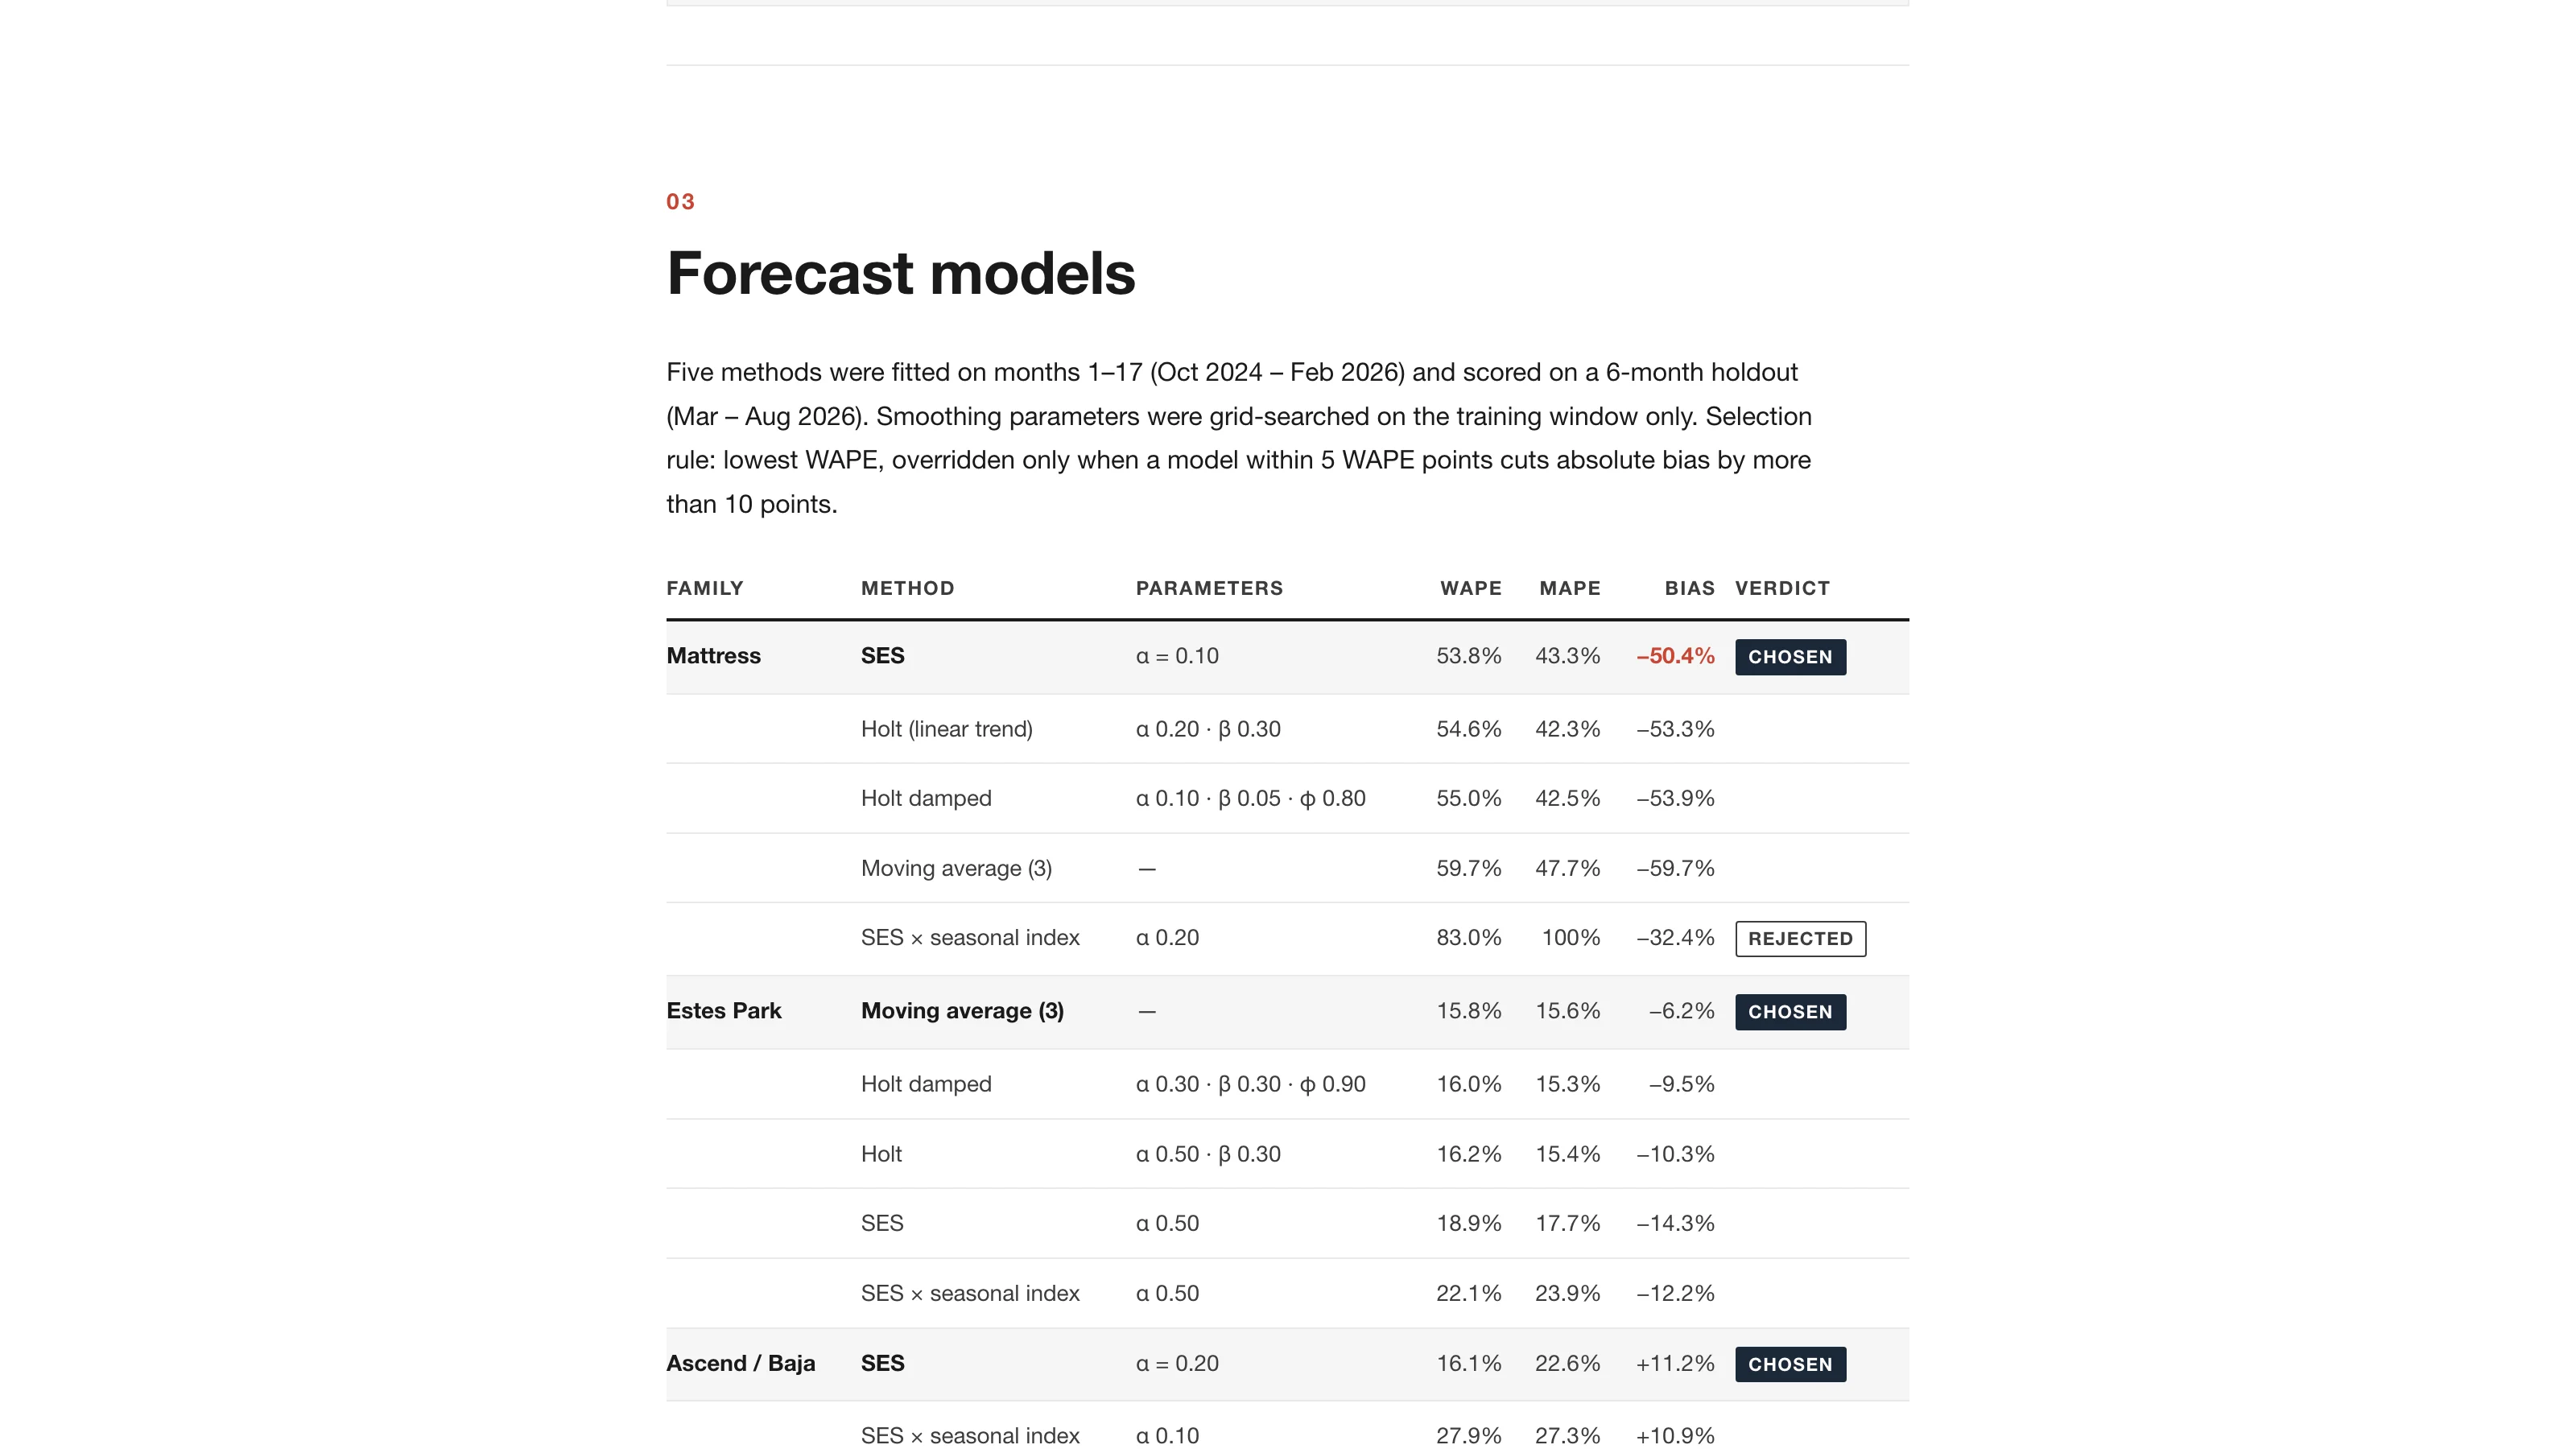
Five methods were fitted on seventeen months and scored on a six-month holdout, with smoothing parameters grid-searched on the training window only. The selection rule is stated: lowest weighted error, overridden only when a model within five points cuts bias by more than ten. Estes Park casegoods chose a three-month moving average at 15.8% error. Tables chose simple exponential smoothing at 16.1%. Mattresses chose exponential smoothing at 53.8%, and the report calls that the honest problem in the document.
The Honest Problem
Every method under-forecast mattresses by 50% or more, because the demand level shifted upward inside the holdout window. That's exactly the situation a static forecast can't see coming. The chosen model, refitted on all 23 months, projects 55 units a month. The last six months averaged 75.
What makes the prompt adaptive is how it handles that. Level and trend update every month as the prior month closes. Parameters and model choice are re-searched quarterly. And a tracking signal, cumulative error over mean absolute deviation, triggers an immediate re-fit at four for two consecutive months and a planner review at six. Run backward on the mattress series, that rule fires in May 2026, three months into the shift and three months before anyone would otherwise have noticed. The report also lists the leading indicators already in NetSuite that would have helped: open sales-order quantity, backordered quantity, purchase-order receipt slippage, and cash-sale line counts at the stores as a foot-traffic proxy.
Seasonality is tested and rejected. The indices suggest a lift in certain months, but with one or two observations per calendar month the seasonal model was the worst performer on holdout, and the report says to re-test when a third year exists.
Safety Stock, Worked
The safety-stock formula combines demand variability and lead-time variability, and the report works it through for four SKUs at 95% service, showing every intermediate number. For the box spring in the baseline case, safety stock is 12.5 units and the reorder point is 17.1. In the disruption scenario, where the two furniture suppliers' lead time doubles and their capacity drops to 60% for ten weeks, safety stock rises 45%, and the report says that eight of those points come from lead-time variance alone.
Pooled across the category, 95% service needs 174 units of safety stock, worth $43K. Held independently at four sites it's about $87K by the square-root rule. The recommendation lands between: safety stock at the two distribution centers that ship 88% of volume, with the stores transfer-replenished and holding display plus one.
Then the service-level trade-off, and a result I found counterintuitive until I saw the arithmetic. For A-class items, 98% service is cheaper than 95%. Total cost, holding plus expected lost margin, falls from $15.9K to $15.3K, because unit margins of $165 to $188 dwarf the $23 to $64 annual cost of holding a unit. Moving from 95% to 98% costs $2.2K more in holding and saves $2.8K in margin.
Working Capital
The current position is $322K on hand against $372K of trailing cost of sales, 1.15 turns. The target policy, baseline demand at 95% across four sites, is $101K of average inventory, which releases about $221K, cuts annual holding cost from $64.5K to $20.3K, and accepts about $4.3K a year of expected lost margin. Even the most conservative policy tested, disruption at 98% with four independent sites and a pre-built reserve, holds less than half of current inventory.
The disruption reserve is priced as an option: a one-time $30.5K that protects $19.8K of margin per event, worth buying only for the mattress line, where no alternate source exists.
What It Recommends
Freeze replenishment on the 24 of 29 SKUs above 240 days of cover and let stock sell down to the reorder point, which releases about $180K over two quarters without touching service. Load reorder points and preferred stock levels to the two distribution centers, since none exist on 25 of 29 SKUs. Record real lead times, because the ones in this report are assumed rather than measured: 373 of 378 receipts share their purchase-order date, so the three-week lead time is a stated assumption and safety stock scales with its square root. Start a monthly forecast review with the tracking signal. And re-test seasonality in October 2027.
Every assumption has a row in the table with its impact on the results, and the appendix has the four SuiteQL queries, the method notes for each model, and the derivation of every headline figure.
Wrapping Up
This is the second of four inventory prompts in the release. The network risk assessment says which suppliers can't be covered by inventory at all, and the replenishment review measures the lead times that this report has to assume.
Adaptive Demand Forecast and Inventory Buffer Planner is in the paid tier of the library. The full sample report from the test account is online, and I covered the whole September release in a separate post.
The recommendation is to hold the right sixty days, sized per SKU and positioned where the volume ships, and let the other 250 convert to cash before the next order goes in.