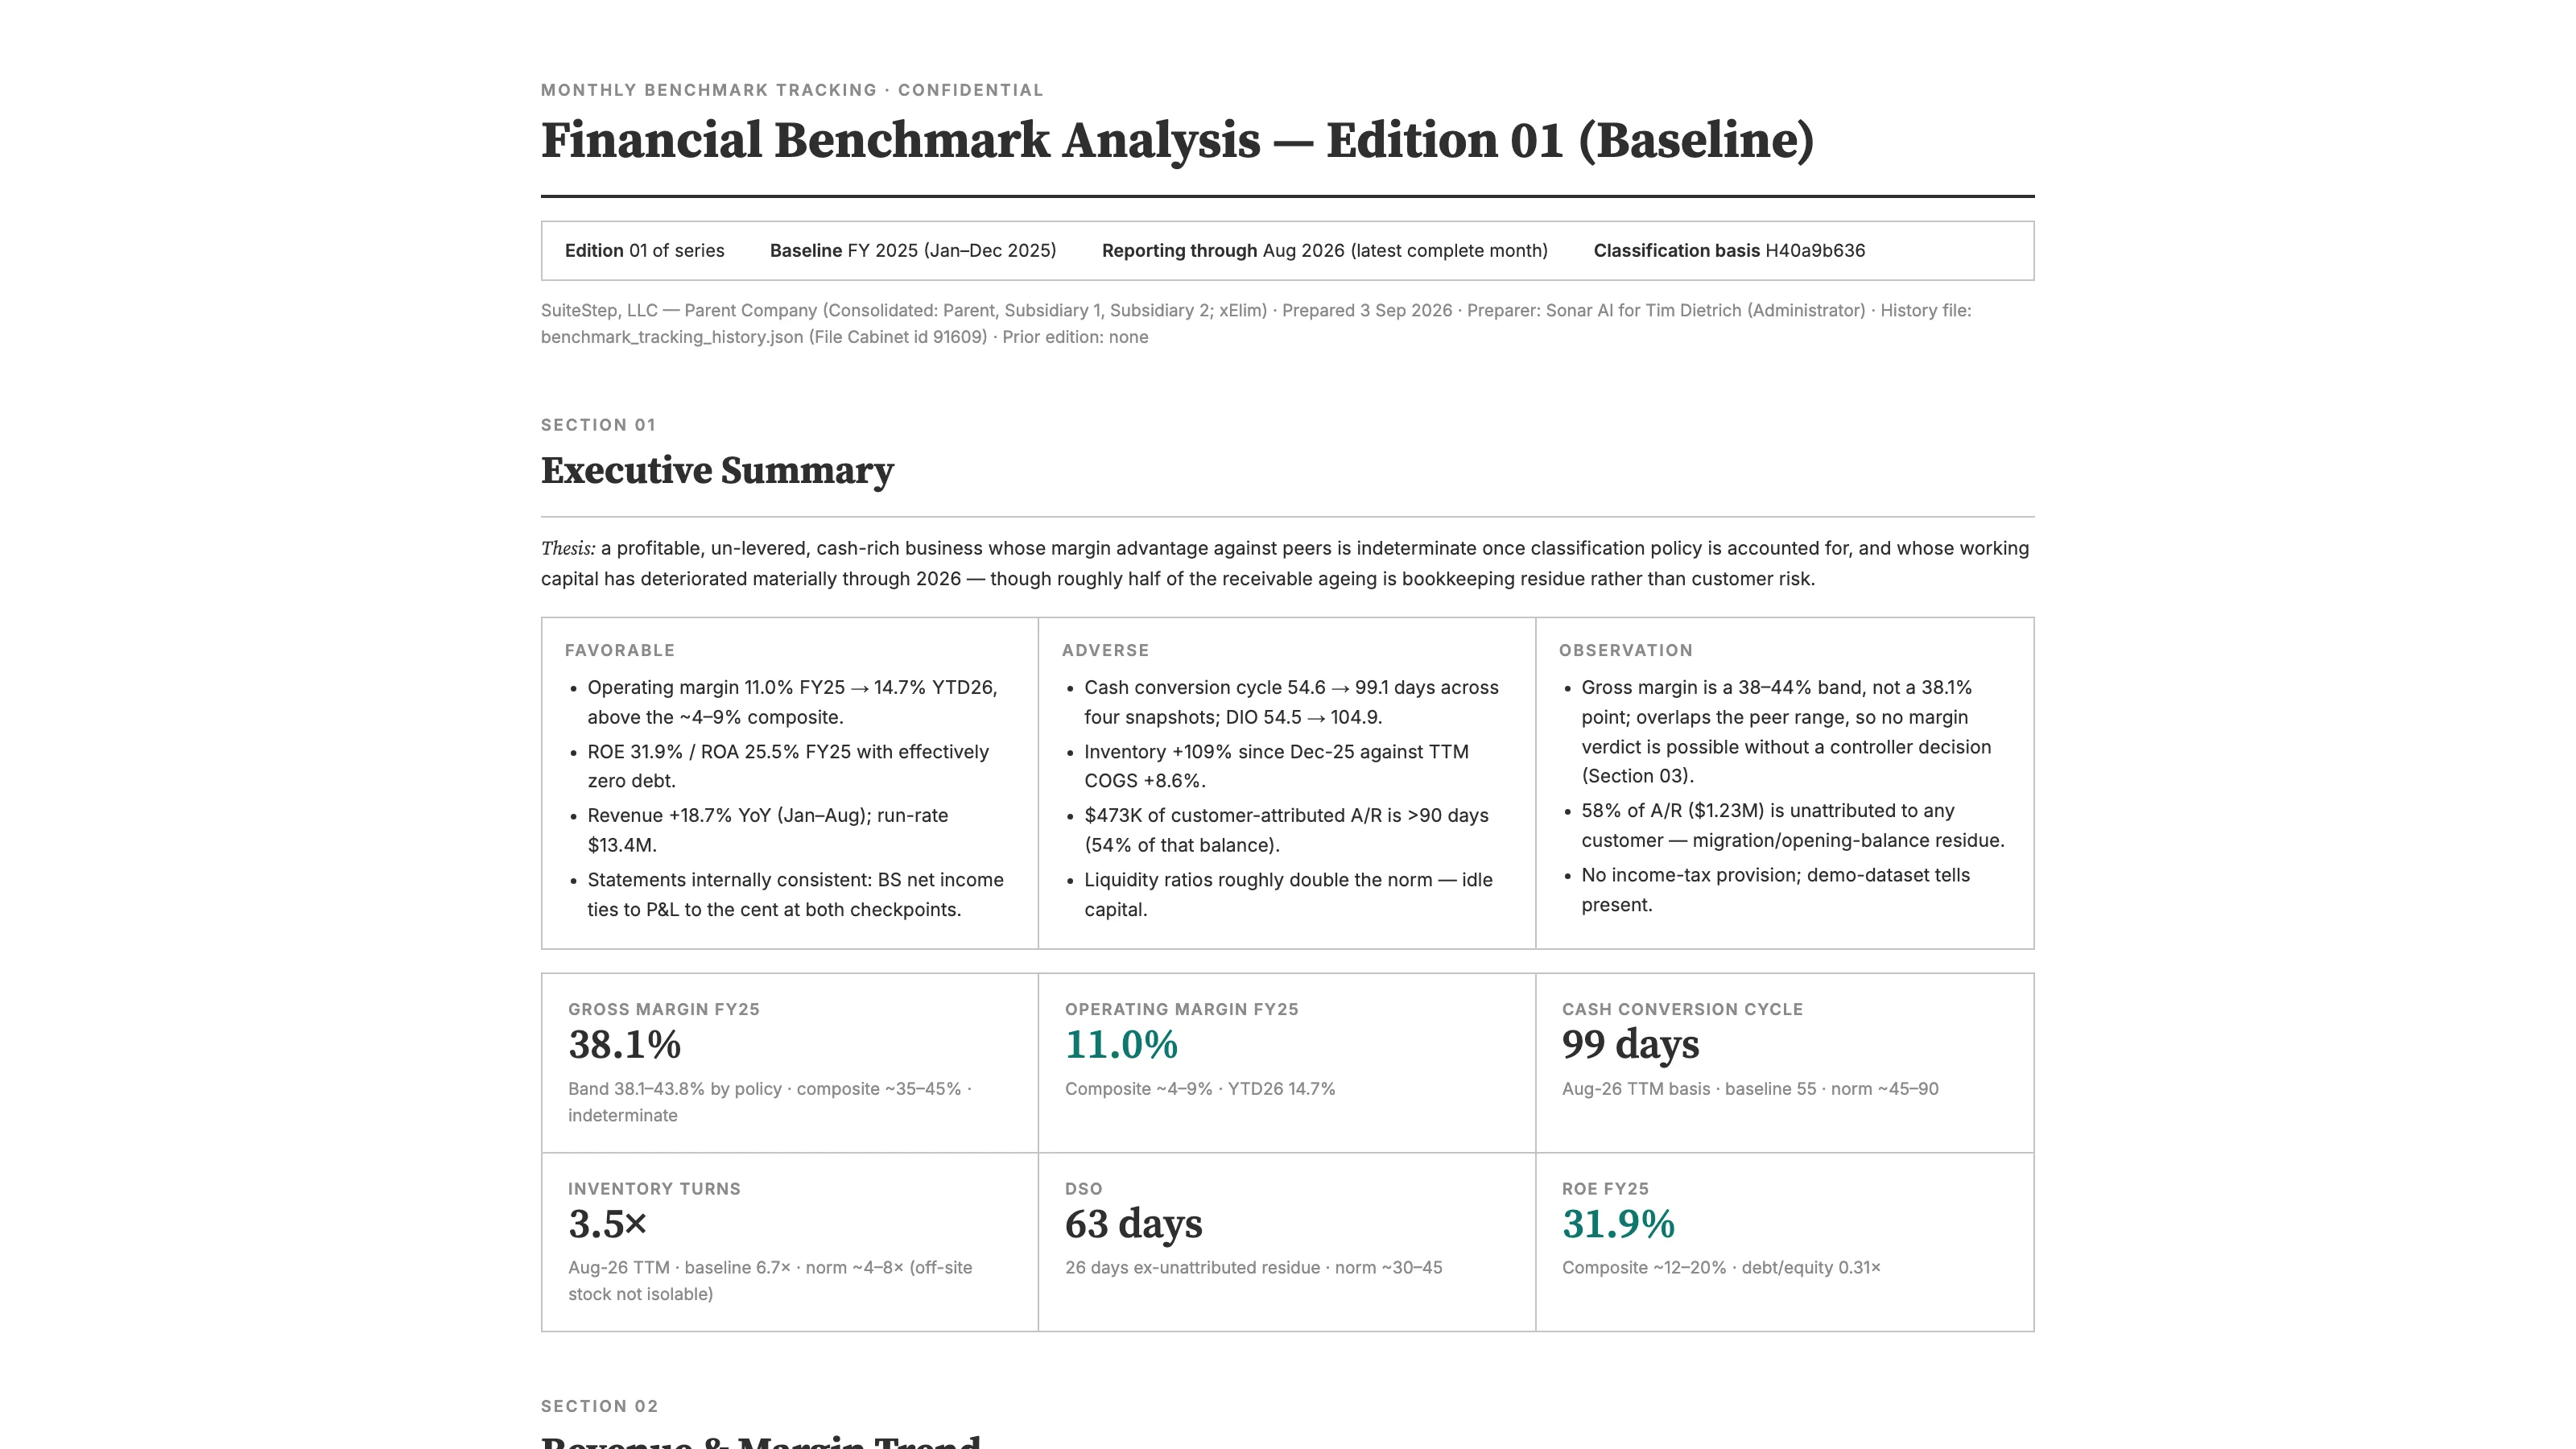
Gross margin on my NetSuite test account was 38.1% in fiscal 2025. The peer composite for blended specialty retail and consumer-goods distribution is roughly 35 to 45%. Any benchmark report would put a dot on that range and call it in line.
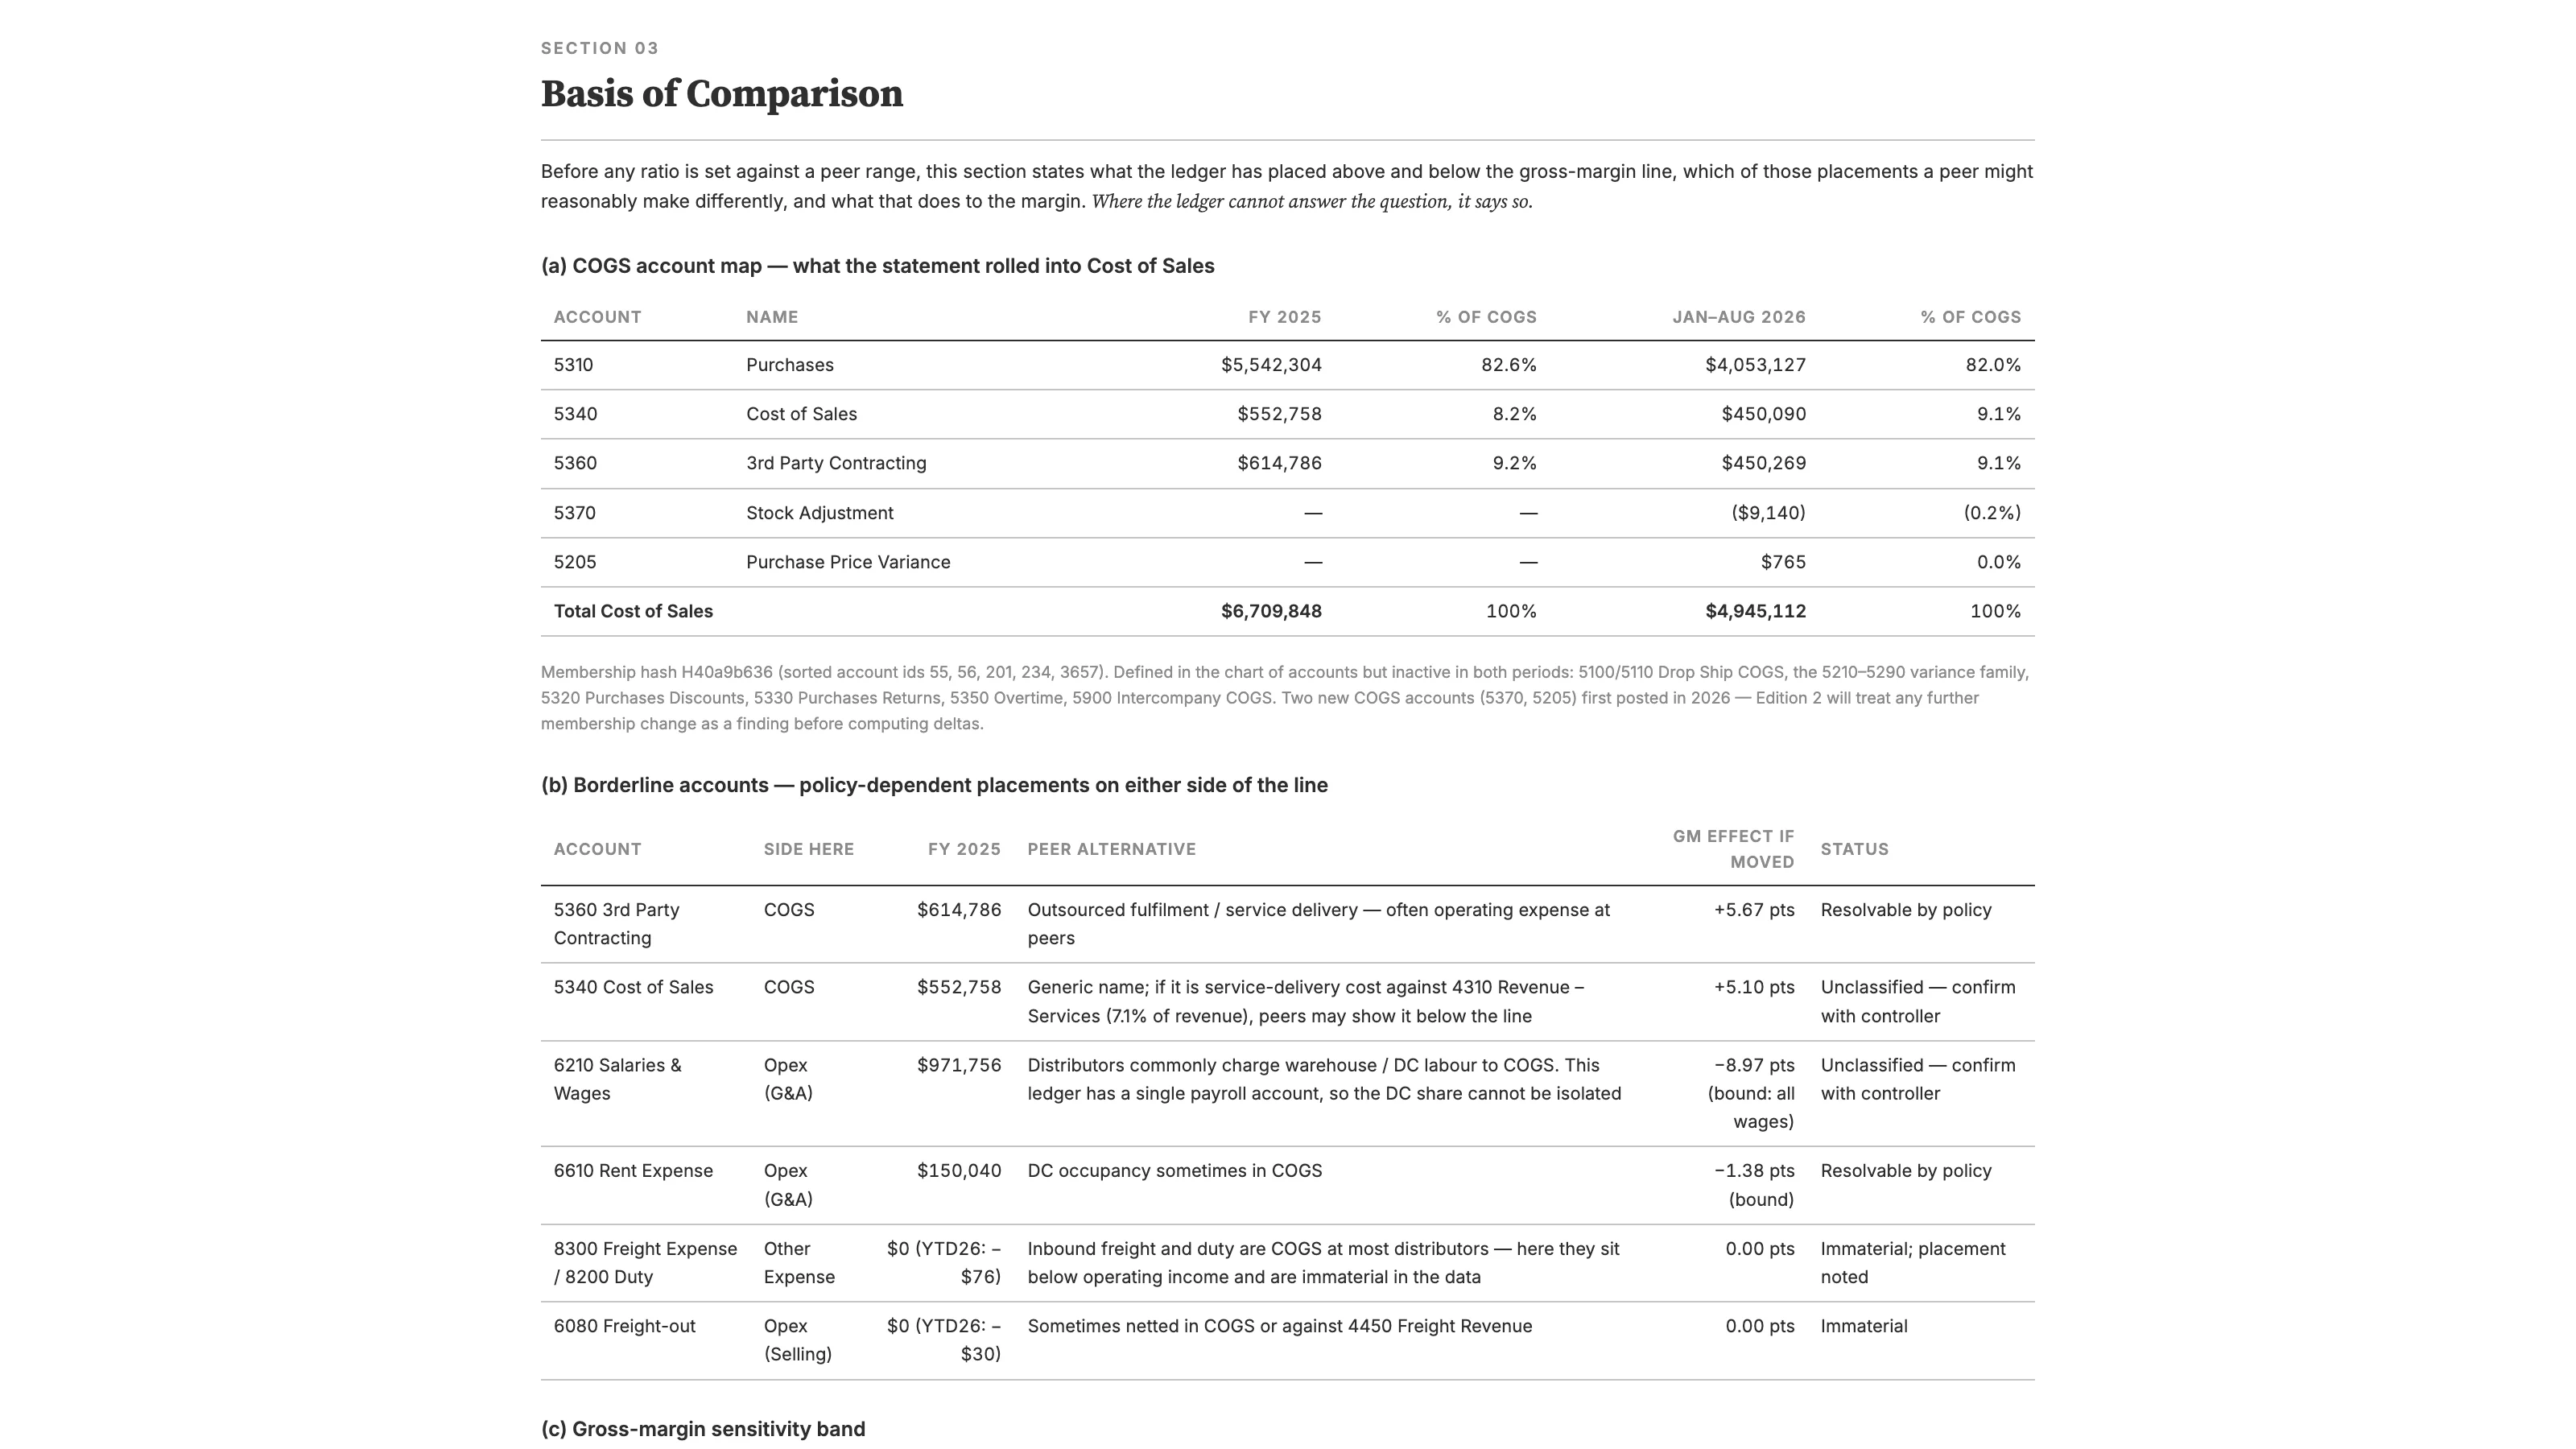
This one refused. Before it compared a single ratio, it listed every account the ledger had placed above and below the gross-margin line and asked which of those placements a peer might make differently. Third-party contracting, $614,786, sits in cost of sales here and is often an operating expense at peers, worth 5.67 points if moved. A generic "cost of sales" account worth another 5.10. A single payroll account with no way to isolate the warehouse labor that distributors commonly charge to cost of sales, worth up to 8.97 points the other way. The quantified band is 38.1 to 43.8%, and the unquantified labor question could move it several points down. The finding is labeled indeterminate, and the first recommendation is to lock the classification basis with the controller so that edition two benchmarks against a settled one.
That's the Financial Benchmark Analysis and Tracking Series, edition one, and it went into the Sonar AI Prompt Library in September. If you're new to this, Sonar AI is an AI agent that runs inside NetSuite. Every prompt in the library is a playbook that I engineered and tested against live NetSuite data, and you run it inside your own account, against your own records. Nothing leaves the account, and nothing is written to it.
A Series, Not a Report
The word "series" in the name is doing work. Edition one writes a history file to the File Cabinet containing the methodology block, the classification basis with a hash over cost-of-sales account membership, four balance-sheet snapshots, monthly gross margins, eight findings, and six recommendations. Edition two reads that file, verifies the hash, computes deltas, dispositions each recommendation with evidence, and appends its own block. The file is never re-emitted. Two new cost-of-sales accounts first posted in 2026, and the report says that edition two will treat any further membership change as a finding before computing any delta.
The working-capital basis, trailing-twelve-month flows against period-end balances, is stated and held constant for every future edition.
What Was Favorable
Operating margin of 11.0% in 2025 and 14.7% year to date against a 4 to 9% composite, and the report notes that this one survives the classification band because moving cost between lines doesn't move it out of operating income. Return on equity of 31.9% with effectively zero debt. Revenue up 18.7% year over year through August. Statements internally consistent: balance-sheet net income ties to the income statement to the cent at both checkpoints, and the receivables aging ties to the balance sheet to the cent. The report shows the cross-checks with the amounts.
What Was Adverse
The cash conversion cycle went from 54.6 days to 99.1 across four snapshots. Inventory more than doubled since December against cost of sales up 8.6%, and turns went from 6.7 to 3.5. The report separates the arithmetic effect, since a trailing denominator lags a growing business, and estimates it explains perhaps a fifth of the move, with the rest real. Days payable rose 25 days over the same window, and the report says the healthy-looking gap between capital absorbed and the cycle is vendor patience rather than operating efficiency.
Then receivables, which split cleanly into two problems. 58% of the balance, $1.23 million, carries no customer and is all more than ninety days old, which the report reads as migration and opening-balance residue rather than customer exposure. Days sales outstanding is 63 days as booked and 26 on the customer-attributed balance. But of the customer-attributed 42%, more than half is past ninety days and concentrated in about ten accounts, five of them above $68,000. Two findings, two recommendations, and both bases shown on the scorecard.
Margin Quality
A separate section scans for credit balances inside cost of sales that mechanically inflate margin. It found one, a $9,140 stock-adjustment credit in August, worth 0.11 points. Immaterial, and recorded anyway, because the account first posted in 2026, its first entry was a credit, and December and March each printed single-month margin spikes of more than two standard deviations that the monthly opening-balance journals probably drove. A costing review is recommendation five.
What It Can't Isolate
Three off-site stock locations exist, third-party logistics, Amazon fulfillment, and in transit, and the balance sheet doesn't split inventory by location, so the report states the direction of bias: a peer that doesn't carry marketplace stock on its own balance sheet will show higher turns for the same operation, and 3.5 turns should be read as a conservative comparison. No income-tax provision exists, so the net-margin row is marked not comparable. The benchmarks themselves are described as approximate published composites, un-normalized for classification policy, and the report says the yardstick carries several points of noise of its own. A live fetch of the sector data source exceeded parseable size, and standard published ranges were used instead, which is stated in the methodology.
How It's Built
Eleven report runs, each with its filters and the rendered header that was verified, and one SuiteQL query for account attributes only. The report says that no figure in any ratio came from a query. Arithmetic was one computation from report figures pasted as constants, with outputs stored verbatim in the history file. The demo-dataset caveat is explicit: the method is production-grade, the trend direction is reliable, the magnitudes aren't.
Wrapping Up
The Cost and Gross Margin Review in the same release works the classification question from the inside, and the Ledger X-Ray found the unattributed receivable residue first.
Financial Benchmark Analysis and Tracking Series is in the paid tier of the library. The full sample report from the test account is online, and I covered the whole September release in a separate post.
The largest variance in the report is one that a policy difference alone could explain. Saying so is the whole value of the benchmark.