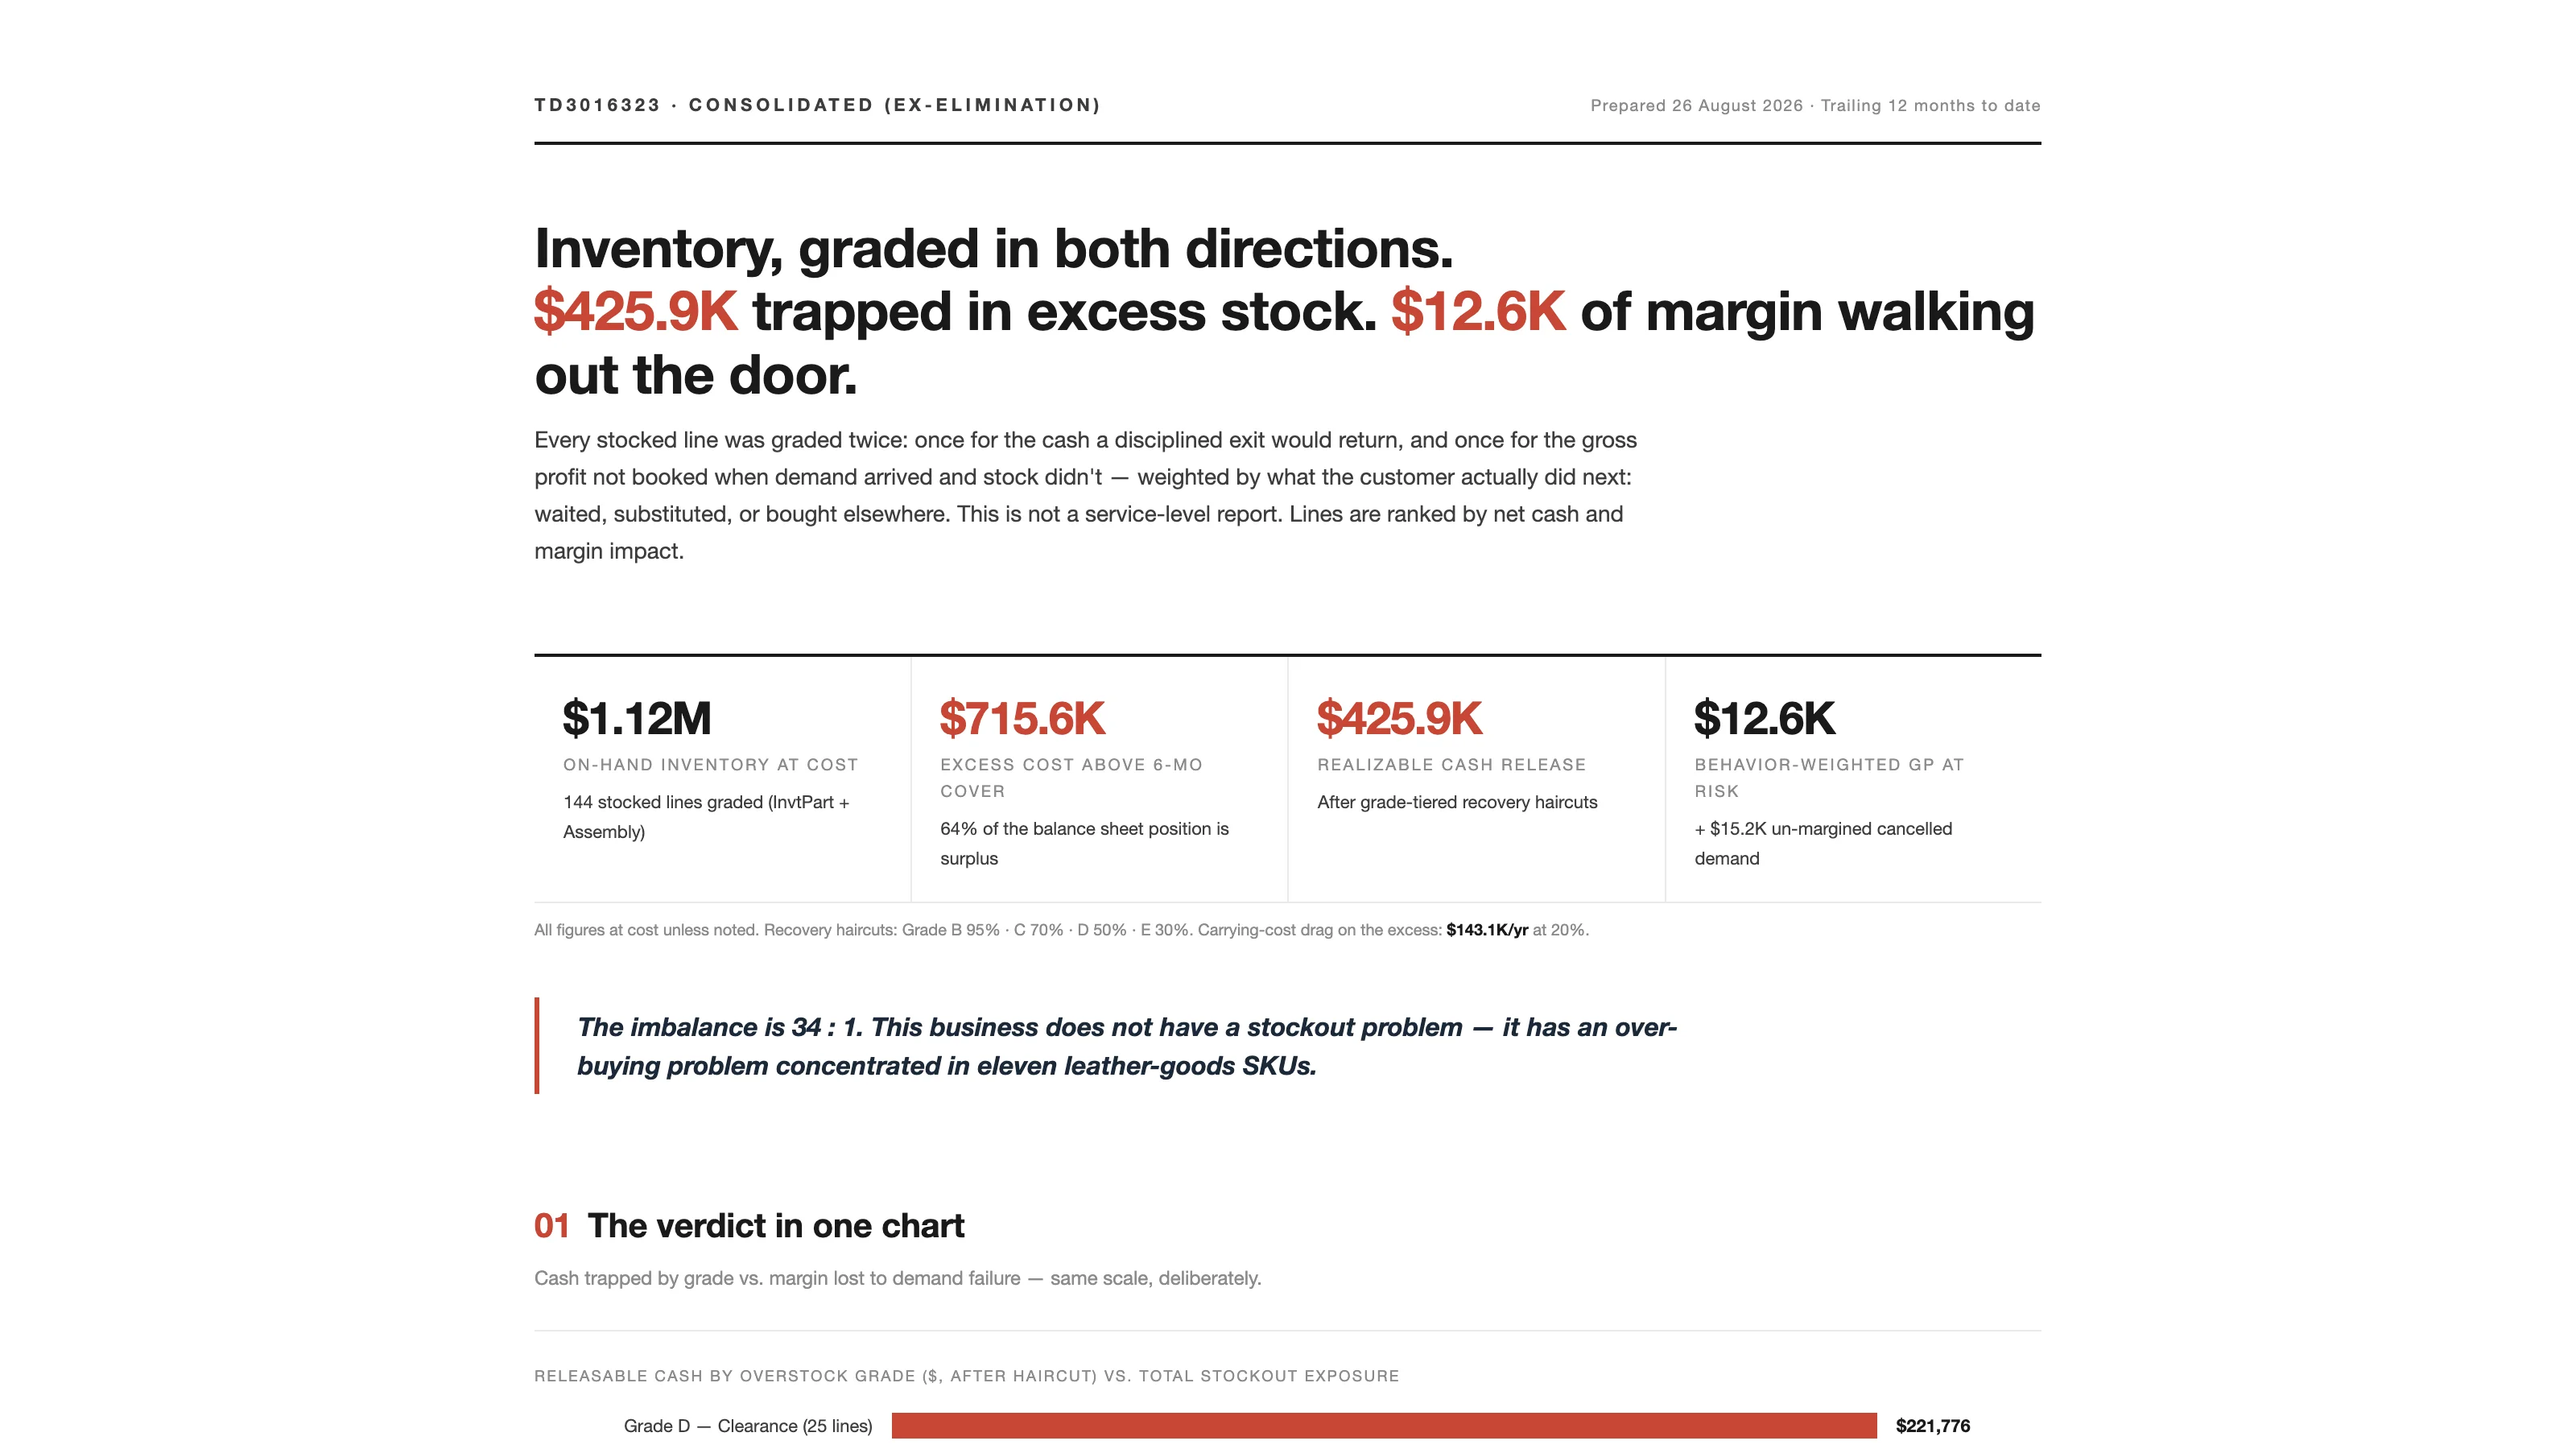
Too much inventory and too little inventory are usually reported separately, and that hides which problem is bigger. On my NetSuite test account, the Inventory Two-Way Grading prompt put both sides in one ledger and the answer came out at 34 to 1. There is $425.9K of cash trapped in excess stock and $12.6K of margin walking out the door.
It went into the Sonar AI Prompt Library in September. If you're new to this, Sonar AI is an AI agent that runs inside NetSuite. Every prompt in the library is a playbook that I engineered and tested against live NetSuite data, and you run it inside your own account, against your own records. Nothing leaves the account, and nothing is written to it.
Graded Twice
Every stocked line was graded once for the cash a disciplined exit would return, and once for the gross profit not booked when demand arrived and stock didn't. The report says at the top that it is not a service-level report, and that lines are ranked by net cash and margin impact.
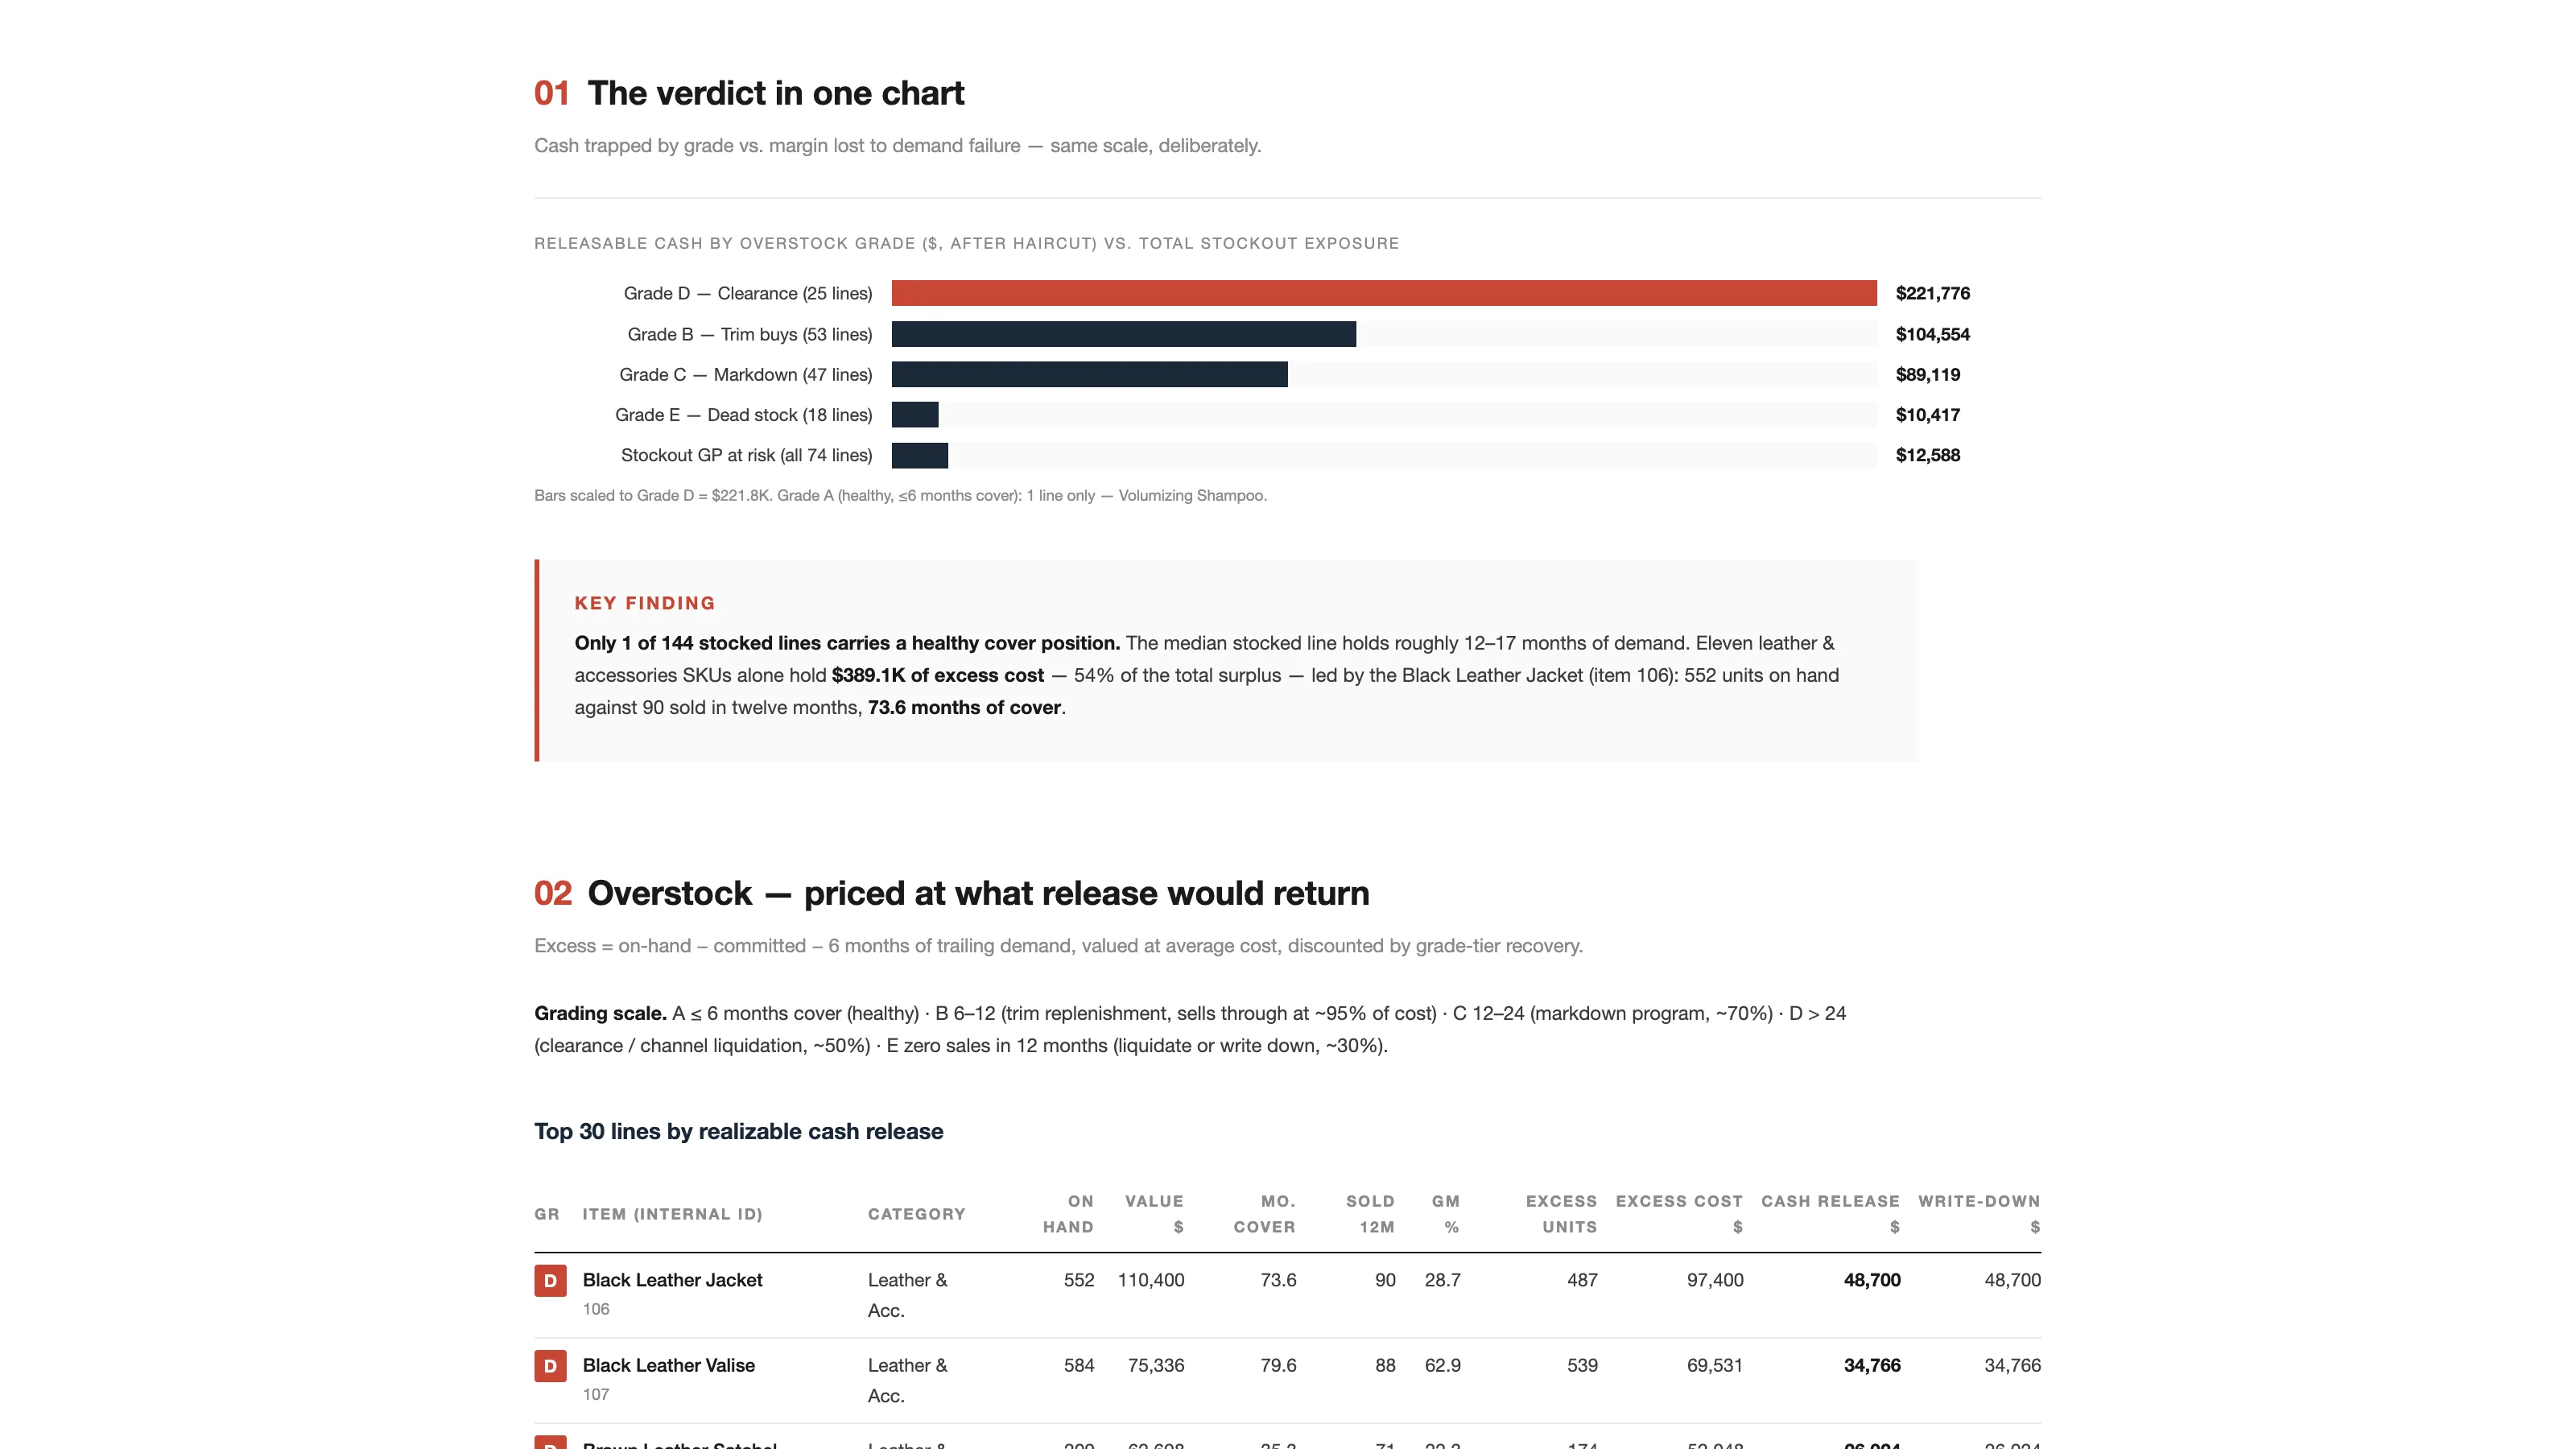
On the overstock side, excess is on-hand minus committed minus six months of trailing demand, valued at average cost. Six months is deliberately generous for a same-day-ship retailer, and the report notes that a three-month target would push excess toward $800K. Each line gets a grade by months of cover, and each grade gets a recovery haircut: B sells through at about 95% of cost, C at 70% through a markdown program, D at 50% through clearance, and E, with zero sales in twelve months, at 30%. Of 144 stocked lines, exactly one is grade A. The median line holds twelve to seventeen months of demand. Eleven leather and accessories SKUs hold $389K of excess cost, 54% of the total surplus, led by 552 black leather jackets against 90 sold in a year, which is 73.6 months of cover.
Weighted by What the Customer Did Next
The stockout side is where the prompt does something I haven't seen elsewhere. Each unfulfilled line is priced at its estimated gross profit and then weighted by the probability the customer walks, inferred from the line's age, the item's proven wait history, and cancellation rates.
The wait history comes from evidence. Order-to-ship latency was measured for every item that shipped in twelve months, and the median item ships the same day. Genuine waits exist on only four items, two of them built-to-order assemblies where customers demonstrably wait six weeks and still take delivery. So a line open for two weeks carries a 10% walk probability, one open past sixty days carries 70%, and the proven-wait items have theirs halved. Demand that was closed unshipped is treated as bought elsewhere, a realized loss rather than a risk, and reported separately as a floor on last year's stockout cost: $15.2K, mostly on add-on lines that carry no estimated margin at all.
The report names the trap this avoids. A conventional fill-rate metric would score the account at about 97% and hide that two thirds of the weighted loss sits in eight furniture and assembly SKUs, while awarding a failure to gift-wrap add-ons with zero margin. Weighted by profit and behavior, the picture inverts.
The Double-Sided Lines
Four items appear on both lists, simultaneously overstocked and failing demand: a canvas backpack, a utility pack, a leather valise, and a chair. There are 328 backpacks on hand and 15 unshipped on an open order. That's an allocation and fulfillment defect rather than a buying defect. It costs nothing to fix, and it's the first item in the action plan, worth $2.9K of gross profit for shipping open lines from stock that already exists.
The Plan, Priced
Seven actions in order of cash impact per unit of effort. Fix the double-sided lines this week. Freeze the open purchase orders landing on lines that are already overstocked. Run a clearance program on the eight leather SKUs plus one mis-classed garment, which even at fifty cents on the dollar returns about $207K. Run a structured markdown cycle on the 47 grade-C lines for about $89K. Write off the eighteen dead lines, recovering what's recoverable through vendor returns and liquidation and booking the roughly $28K hit now. Protect the two proven-wait assemblies with component availability rather than finished-goods stock. And investigate the Estes Park Chair, which sells at a 2.7% margin while holding 21.6 months of supply, because at that margin its stockout lines are barely worth chasing until the price is fixed.
The net position is stated plainly. A disciplined exit returns about $426K of cash against a one-time write-down of about $250K and removes a $143K annual carrying drag. Total demand-failure exposure, realized plus expected, is under $28K a year. The report's summary of the ratio is that every dollar of buying discipline on this account is worth about fifteen dollars of safety stock.
Assumptions and Limits
The assumption table gives each parameter, its value, and its sensitivity. Recovery rates are conservative liquidation norms and may understate what branded leather goods return. Carrying cost is 20%. Committed stock is netted before grading. Zero-cost demo items are graded but their release value is set to zero rather than monetized. Lost sales that never became orders are invisible, so the stockout figure is a floor. Substitution couldn't be measured because the substitution field is unused. And several data artifacts, a negative on-hand quantity, an assembly with negative margin, future-dated sales, were flagged rather than priced.
Five SuiteQL queries and the grading model, as pseudocode, are in the method section. Write-downs require controller review before booking, and grade assignments should be checked with merchandising before any clearance runs.
Wrapping Up
This report pairs with the Replenishment Engineering review run the same day, which uses these grades to suppress replenishment on 56 lines until their cover burns down. The Cost and Gross Margin Review reaches the same leather-goods conclusion from the income statement side.
Inventory Two-Way Grading is in the paid tier of the library. The full sample report from the test account is online, and I covered the whole September release in a separate post.
This account has an over-buying problem in eleven SKUs and a fulfillment problem in four. No fill-rate report would have told you either.