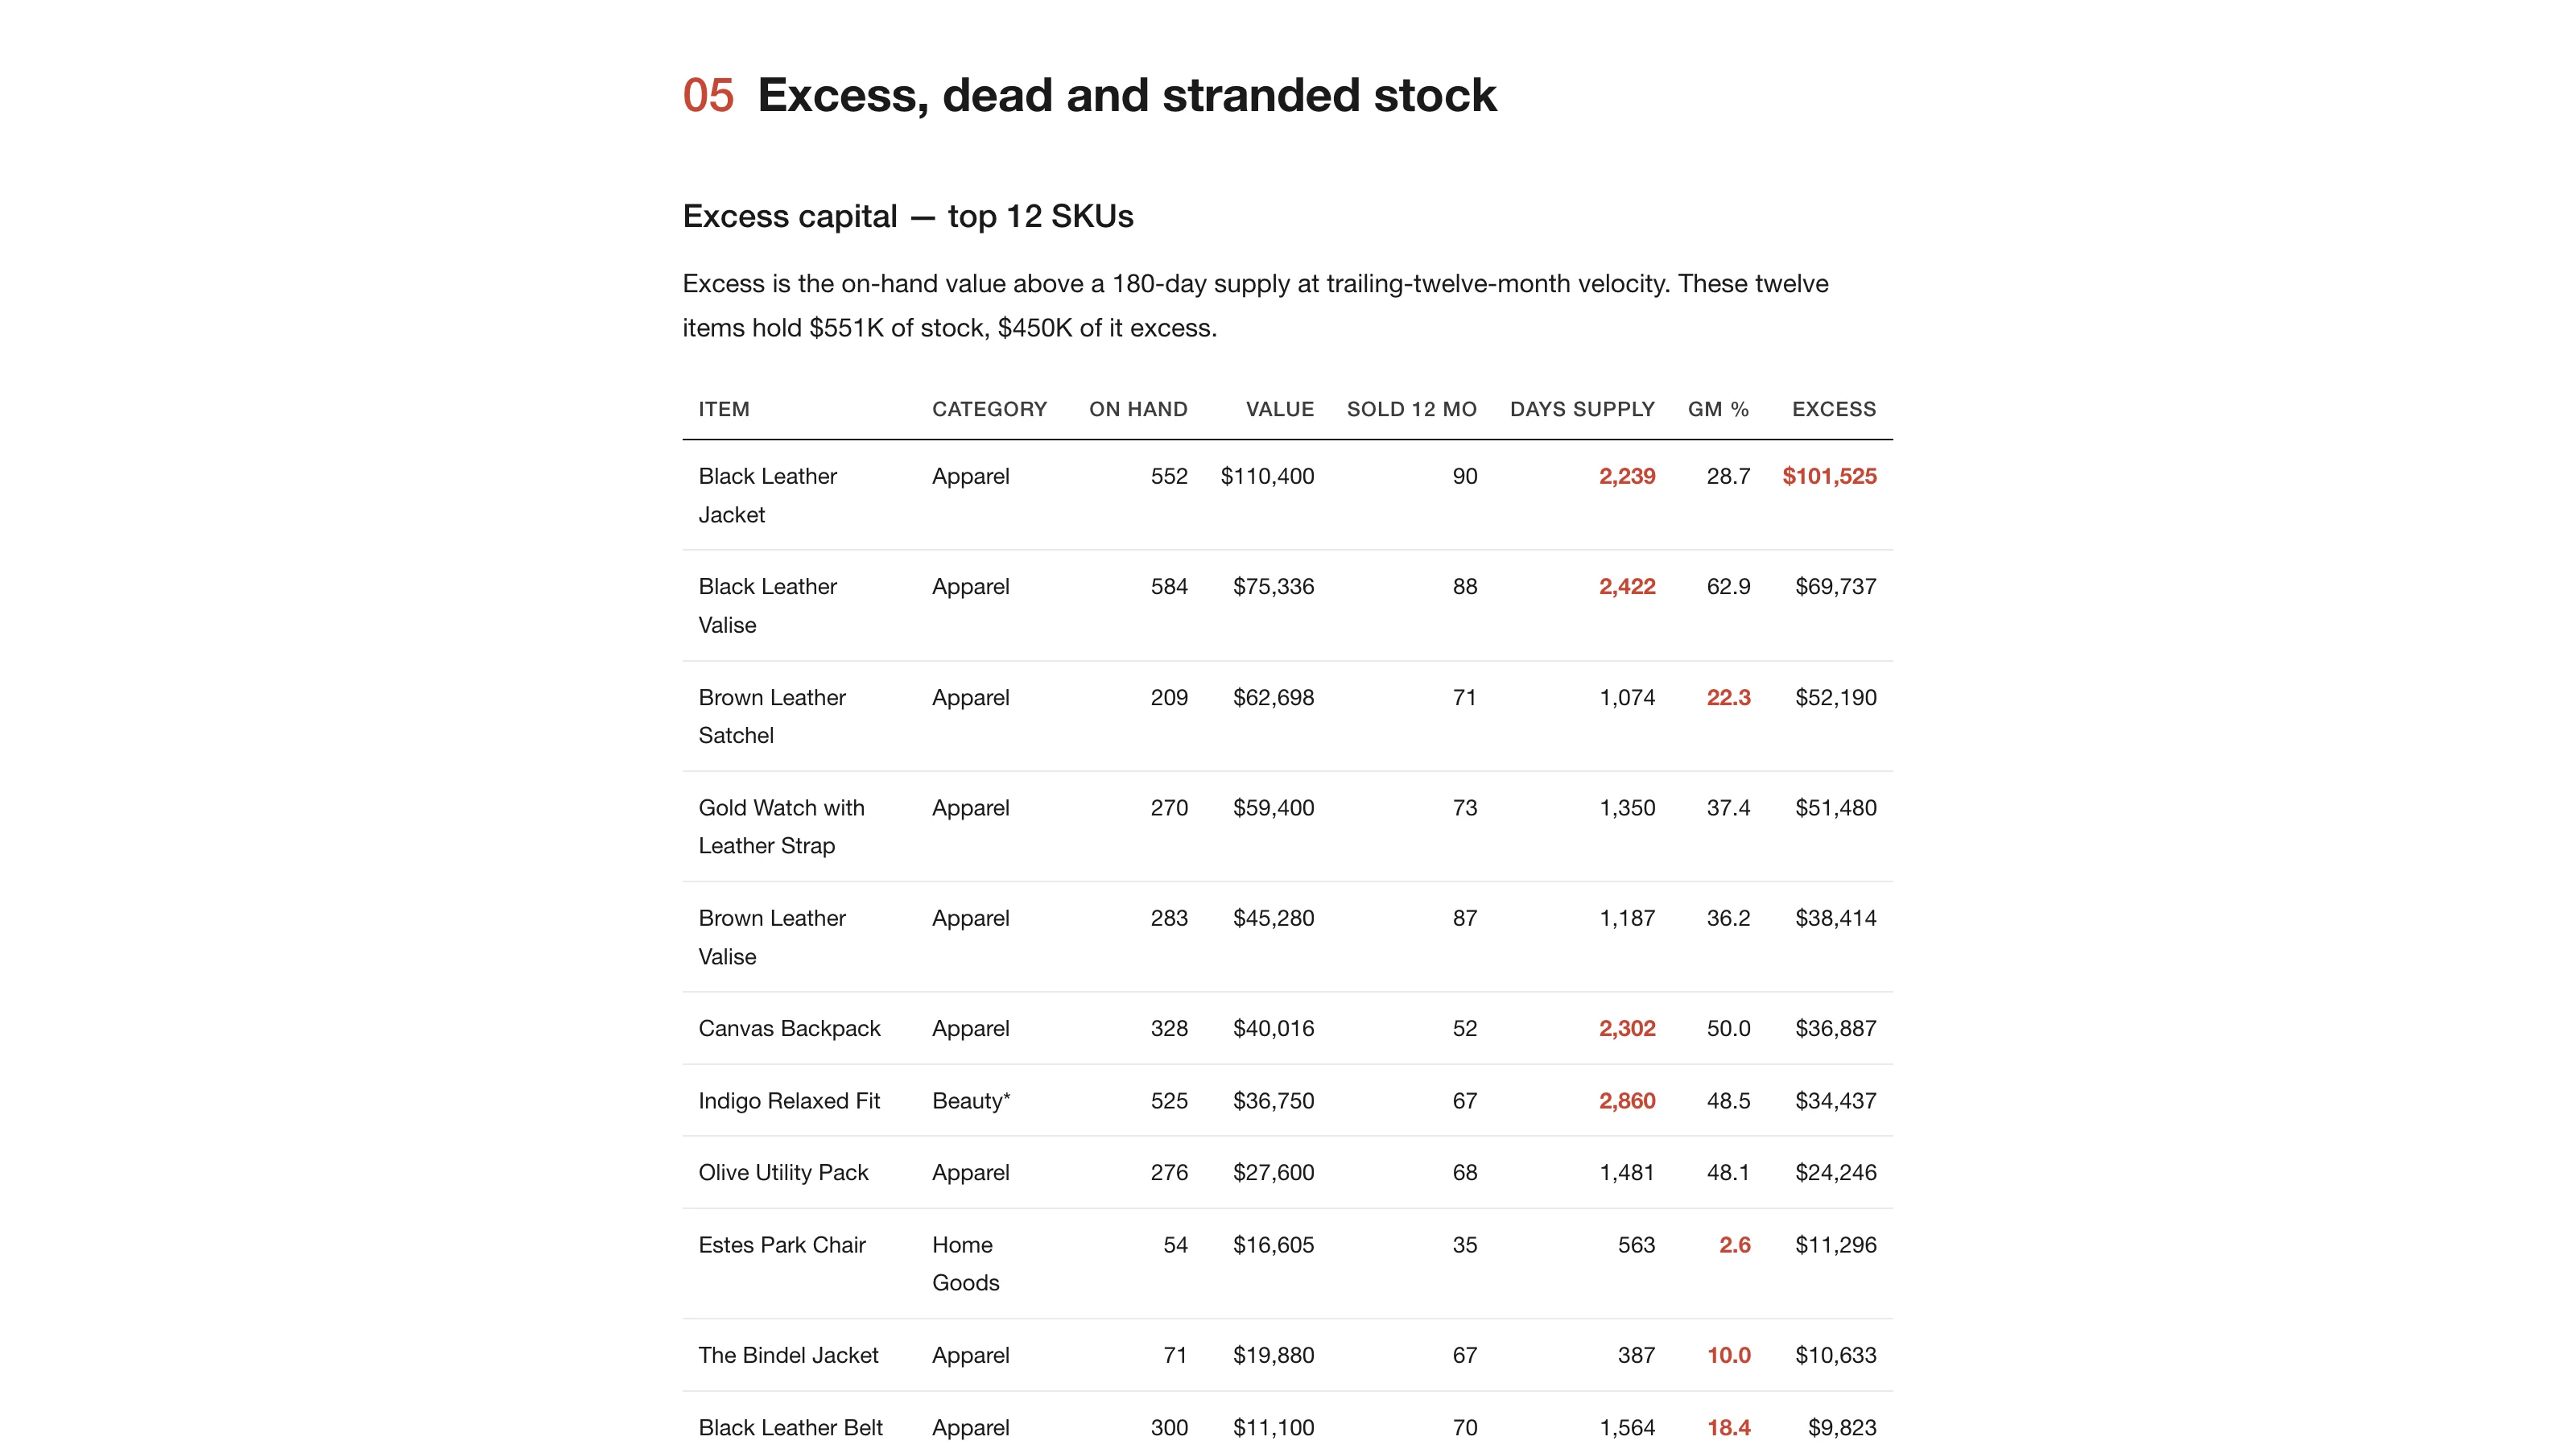
There are 552 black leather jackets in my NetSuite test account's inventory. Ninety sold in the last twelve months. At that rate the stock on hand lasts a little over six years, and the jacket earns a 28.7% gross margin when it does sell, which is the thinnest in its category.
The Cost and Gross Margin Review with Inventory Investment Diagnostic starts on the income statement, finds that the reported margin improvement is synthetic, and then follows the real margin onto the balance sheet, which is where the cost problem on this account turns out to live. It went into the Sonar AI Prompt Library in September. If you're new to this, Sonar AI is an AI agent that runs inside NetSuite. Every prompt in the library is a playbook that I engineered and tested against live NetSuite data, and you run it inside your own account, against your own records. Nothing leaves the account, and nothing is written to it.
Two Margins
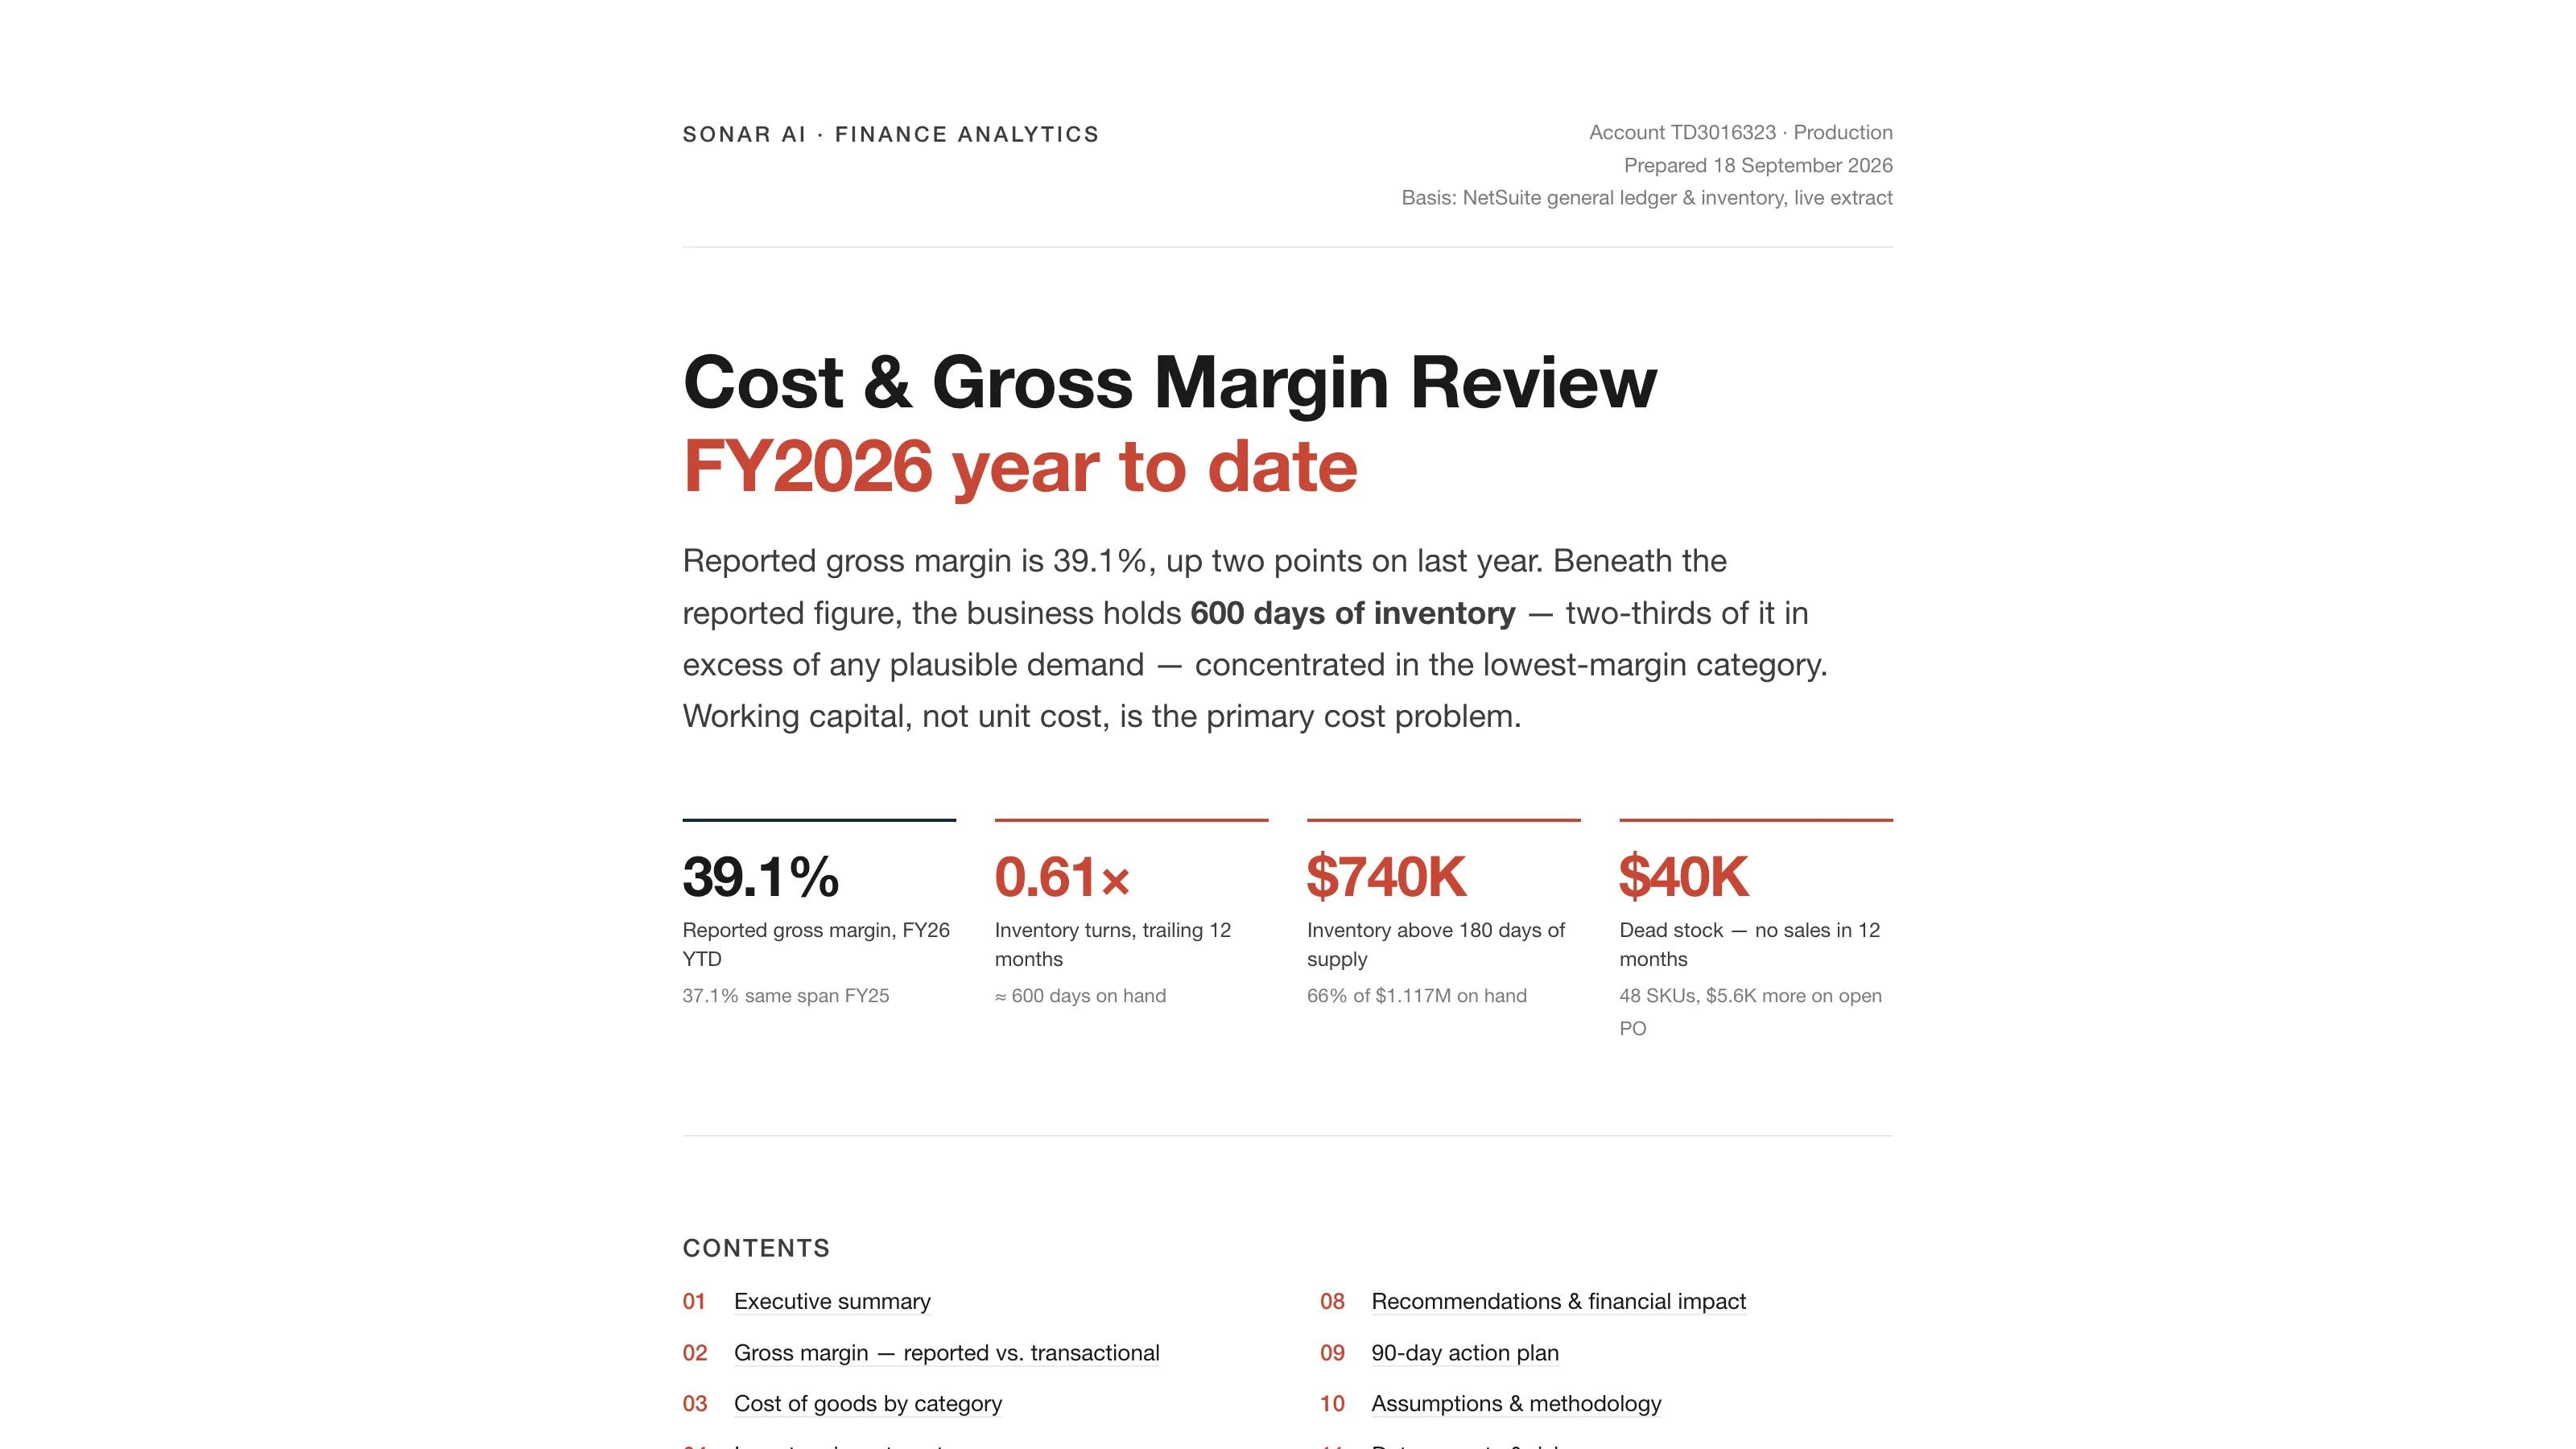
Reported gross margin for the year to date is 39.1%, up two points on the same span last year. The report shows that number, ties it to the income statement by posting period, and then explains why it means almost nothing. The two-point improvement comes entirely from the purchases account falling from 51.9% to 49.8% of revenue, and that account is fed by the synthetic monthly journals that other posts in this series have covered. It's 100% synthetic on this ledger.
The transactional view, with those journals excluded, shows a 63.6% blended margin, up from 50.6%, and about 44% on physical product. That improvement is real and large, and it came from mix. The report's conclusion is that cost-reduction effort should go to the balance sheet, because the unit-cost lines on the income statement aren't where the money is.
Six Hundred Days
$1,116,806 of inventory is on hand against $679,211 of trailing twelve-month cost of sales. That's 0.61 turns, roughly 600 days of supply, against a retail norm the report quotes as 45 to 90. $739,751 sits above a 180-day supply threshold, which is two thirds of everything on hand. Of 185 stocked SKUs, exactly one has less than six months of supply.
Apparel is where the capital is trapped. It holds 56% of inventory dollars, generates 35% of cost of sales, turns 0.38 times, and carries the thinnest category margin at 40.9%. Eight leather-goods and bag SKUs hold $457K of stock, $409K of it excess, at three to eight years of supply each. One of them, a relaxed-fit garment, is classed as Beauty in the item master, and the report notes that it is almost certainly apparel.
The report prices the excess. At a 20% annual carrying cost, which it states as an assumption and not an account value, the excess costs $148K a year to hold, equivalent to 16% of real gross profit. Releasing it to a 180-day supply level would free about $740K of working capital.
Stock in the Wrong Place
Then there's the inventory that isn't dead or excess in aggregate but is simply somewhere it doesn't sell. $159,929 across 97 item-location pairs sits at a location where that item has recorded no sales in twelve months while the same item sells elsewhere. The San Francisco store carries 168 SKUs, more than either distribution center, which the report describes as a store operating as a warehouse. It also holds 461 units of copper, which is difficult to justify in a retail store on any reading.
That copper is part of a pattern. The dead-stock list, 48 SKUs with no sales in twelve months, is mostly electronics and miscellaneous items with the profile of manufacturing components: copper, solder mask, nuts, caps, speakers. The report says that raw material is legitimate inventory if it feeds work orders, that nothing has consumed these in twelve months, and that the 24 open work orders should be checked before anything is written down. I appreciate that it stopped short of recommending disposal on evidence that doesn't quite support it.
Purchasing Without a Governor
Reorder points exist on four of 185 items. Open purchase orders are still landing units into SKUs that already have multi-year supply or haven't sold in a year. One purchase order, PO395, sends $5,620 of goods to the Chicago distribution center and every line on it is into dead or thousand-day stock. Eight separate small purchase orders for the same hoodie were raised in one month, which suggests no consolidated replenishment logic at all. The total open exposure is modest at $8,084, and the report says the pattern matters more than the amount.
What It Recommends
Eight actions ranked by financial weight, then a 90-day plan in three phases. Days one through fourteen: cancel PO395, reject the pending monitor order, hold the hoodie orders, freeze purchasing on anything over 365 days of supply, and check the components against work orders. Days fifteen through forty-five: launch the apparel clearance, transfer the stranded stock to where it sells, review the six sub-25% margin items, and book the dead-stock write-down. Days forty-six through ninety: load reorder points and preferred stock levels to all 185 SKUs from the velocity model, start a monthly turns report, and add a purchase-order approval rule that projected days of supply after receipt can't exceed 365.
The cash-release scenarios are shown as a table with the recovery rate as a visible planning assumption. Aggressive clearance of the top eight apparel SKUs at 70% recovery releases $286K. All excess to 180 days at 80% blended releases $592K.
How It's Built
Eight SuiteQL queries in Appendix A, plus the reduction logic that turns on-hand quantity and velocity per item into days of supply and excess, printed as commented JavaScript. Every assumption is in a table: the comparison span, the synthetic-journal exclusion, how categories are attributed when the item class is empty, the velocity window, what counts as excess, the 20% carrying cost, and the benchmarks, which the report says are quoted for orientation only. The caveats section lists what could change the conclusions, starting with the demonstration ledger and ending with the one-year lookback.
Wrapping Up
This prompt pairs naturally with the inventory prompts later in the release. Inventory Two-Way Grading prices overstock and stockouts side by side, and Replenishment Engineering sizes reorder points against measured supplier lead times. This one tells you that you have a problem and how big it is. Those two tell you what to hold instead.
Cost and Gross Margin Review with Inventory Investment Diagnostic is in the paid tier of the library. The full sample report from the test account is online, and I covered the whole September release in a separate post.
Margin on the income statement and cash in the warehouse are the same story told in two places. On the test account, the warehouse was telling it more honestly.