Every number in this report carries a verb. "Measured" means that a query ran, and the query is reproduced in the appendix. "Inferred" means that the number was derived from measurements, and the derivation is printed next to it. "Assumed" means that the report is telling you it doesn't know, along with what would confirm it. Nothing is assumed silently, and nothing is benchmarked against outside data.
I'm leading with the verbs because they're the point of the Instance Integrity Diagnostic. The prompt exists to answer the question that comes before every other report: can you trust the instance that's producing the numbers? A report that asks that question has to hold itself to a higher standard of evidence than the reports it's checking, and the verbs are how it does that.
It's one of the four free prompts that went into the Sonar AI Prompt Library in September. If you're new to this, Sonar AI is an AI agent that runs inside NetSuite. Every prompt in the library is a playbook that I engineered and tested against live NetSuite data, and you run it inside your own account, against your own records. Nothing leaves the account, and nothing is written to it.
What It Sweeps
The prompt works through the account in a fixed order: classify, measure, find, design, deliver. It starts with the structure of the account, from feature flags to custom segments. Then it measures revenue by year and document type, receivables and aging, customer concentration, dimensional coverage on every transaction line, and a few governance checks like whether credentials are sitting in custom fields. Every finding gets a severity. Critical means invisible until an auditor finds it. High means a quantified exposure. Medium means a control or process gap.
Then it writes the findings register, in the order you should fix things, with an effort estimate for each.
What It Found
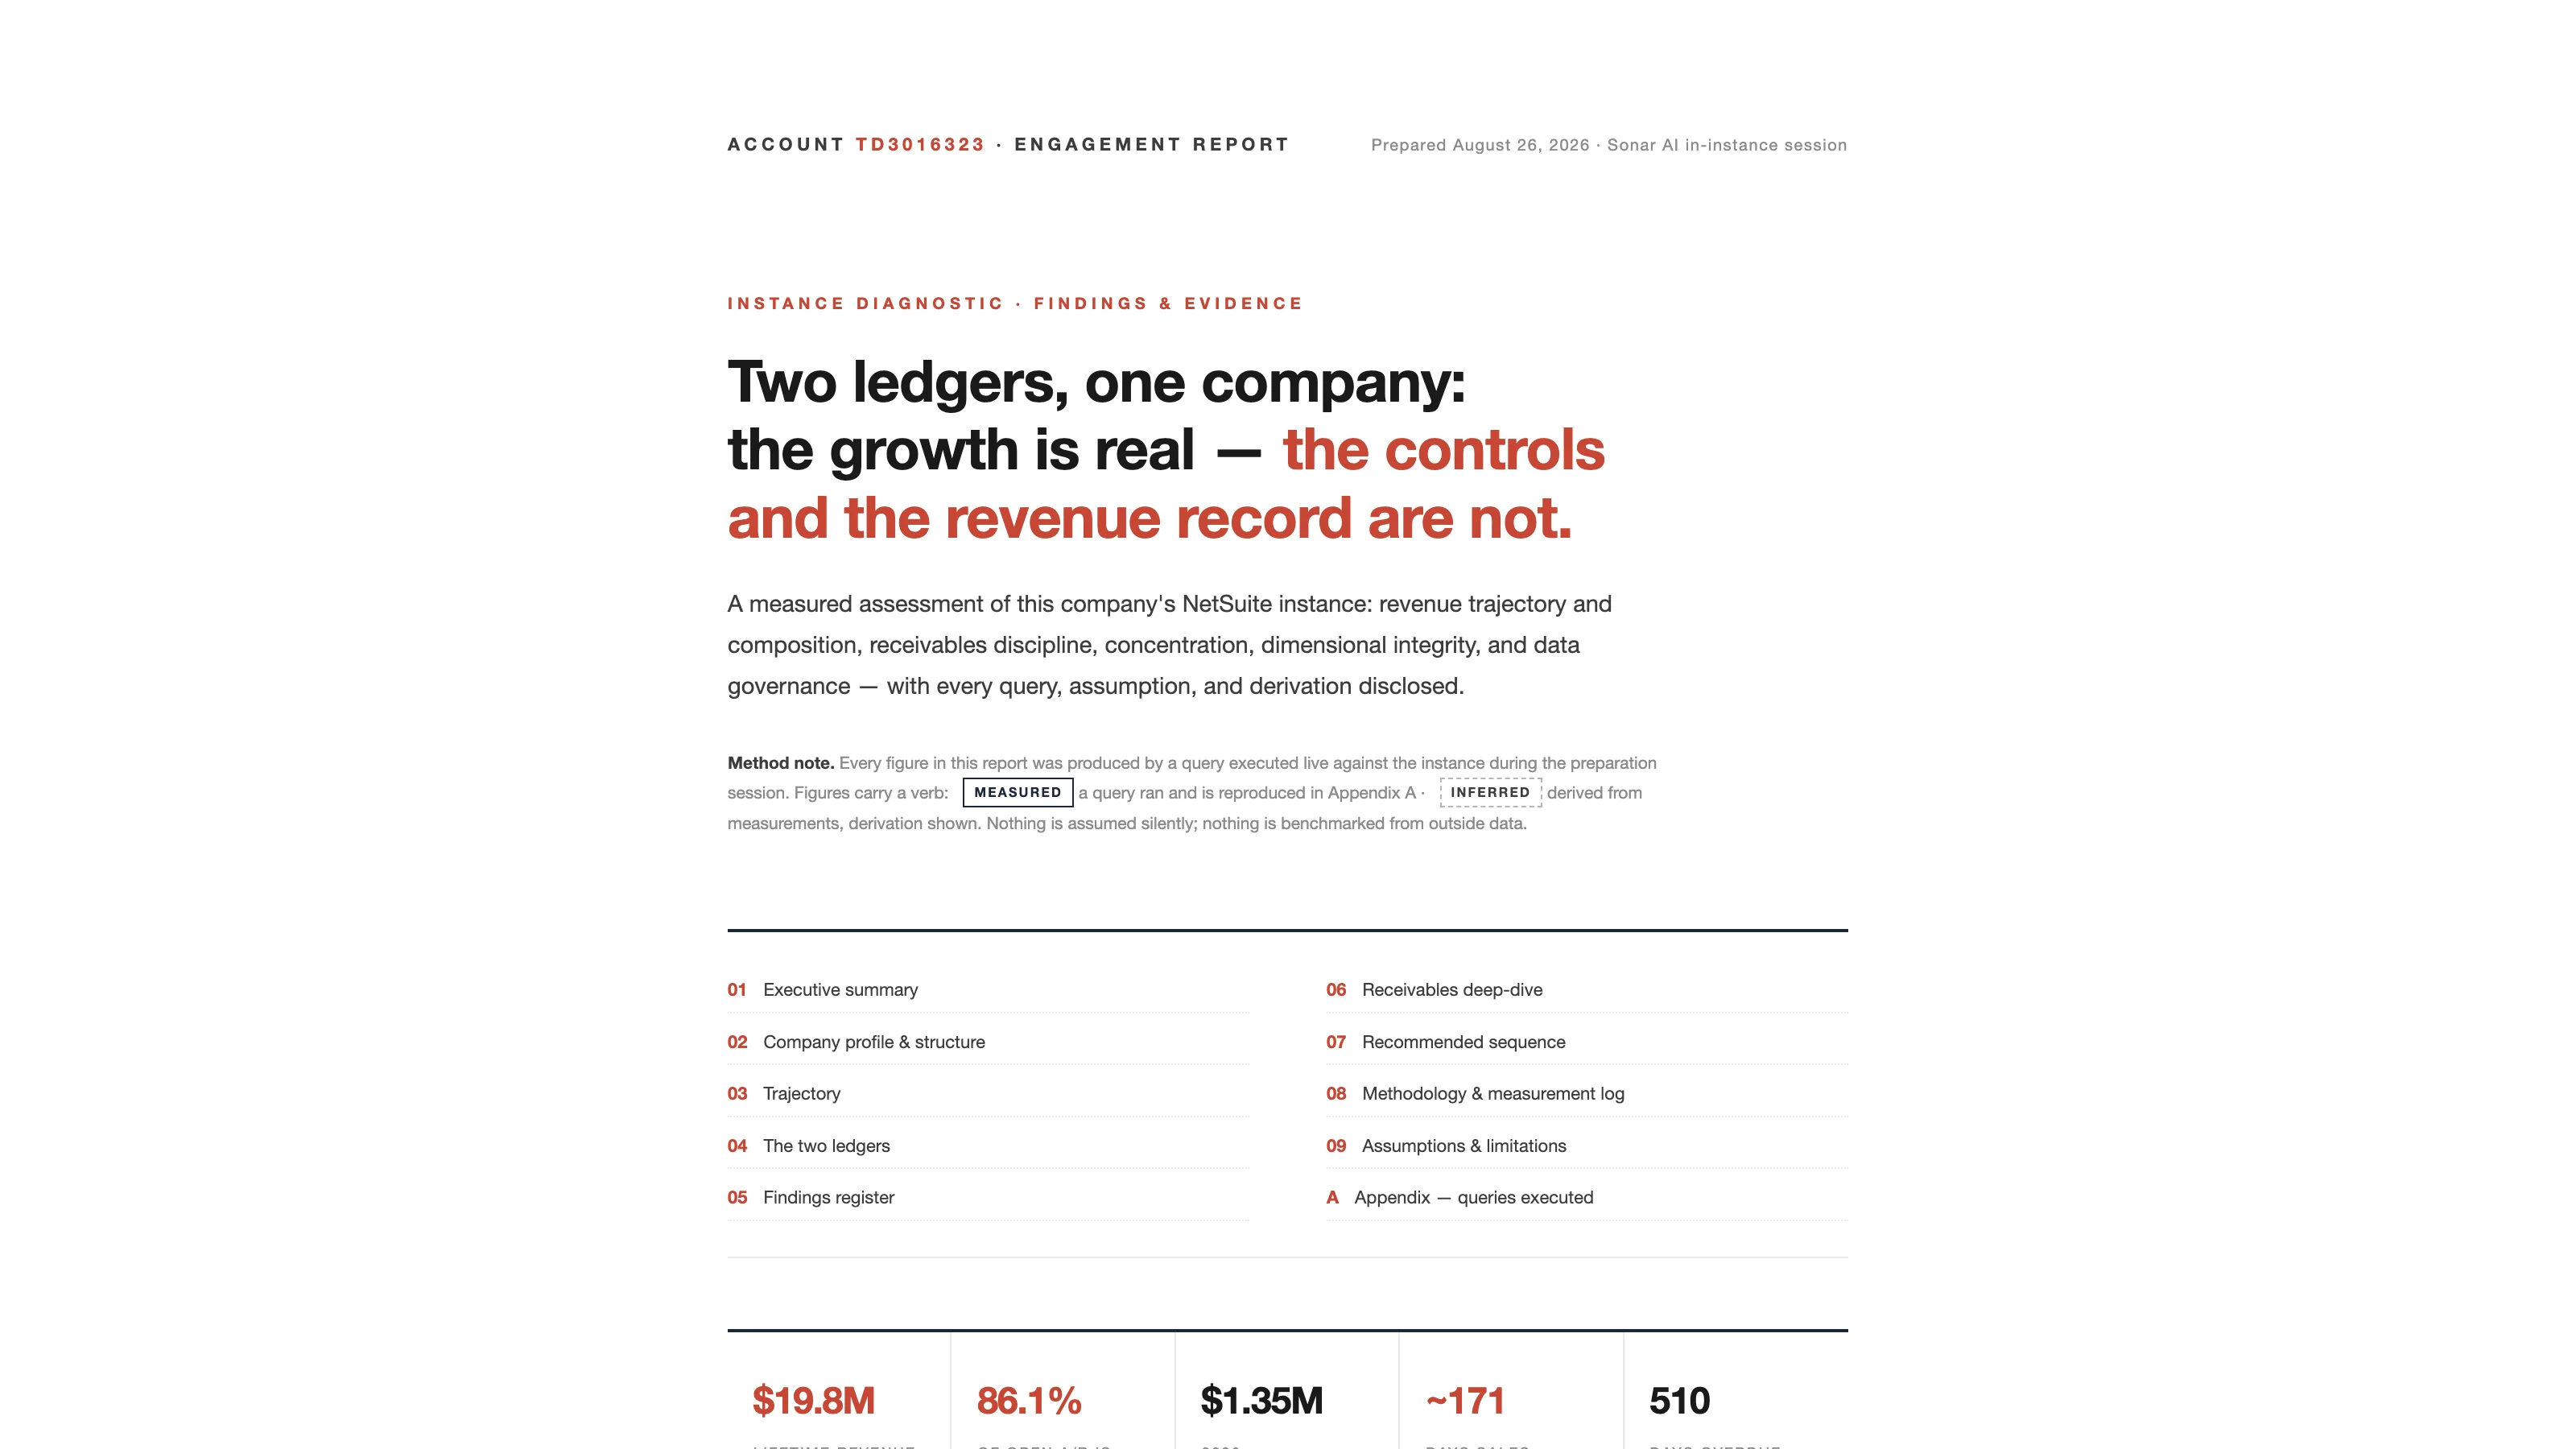
The test account is a four-entity OneWorld setup, single currency, running a two-speed business: high-volume retail through two stores and low-volume, high-value wholesale through two distribution centers. The two stores produced 1,551 transactions and 9% of tagged lifetime revenue. The two distribution centers produced 278 transactions and 64.5%. The average ticket in the San Francisco store is $178, and the average ticket at the Los Angeles distribution center is $6,033. Transactionally, the company has become a wholesaler with a retail storefront, and 2026 year-to-date revenue of $1.35 million has already passed all of 2025.
That's the good news, and the report spends about a page on it before it gets to the three problems that dominate everything else.
The revenue record is split in two. The general ledger (GL) reports $8.39 million of 2026 income. Invoices and cash sales explain $1.35 million of it. The remaining $7.04 million, or 83.9%, arrives through 48 recurring monthly journal entries posted directly to two income accounts, with no customer, item, or document behind any of it. The pattern goes back to September 2024, and over the life of the account it adds up to $19.8 million, which is 87% of all GL income. Cost of goods sold shows the same pattern.
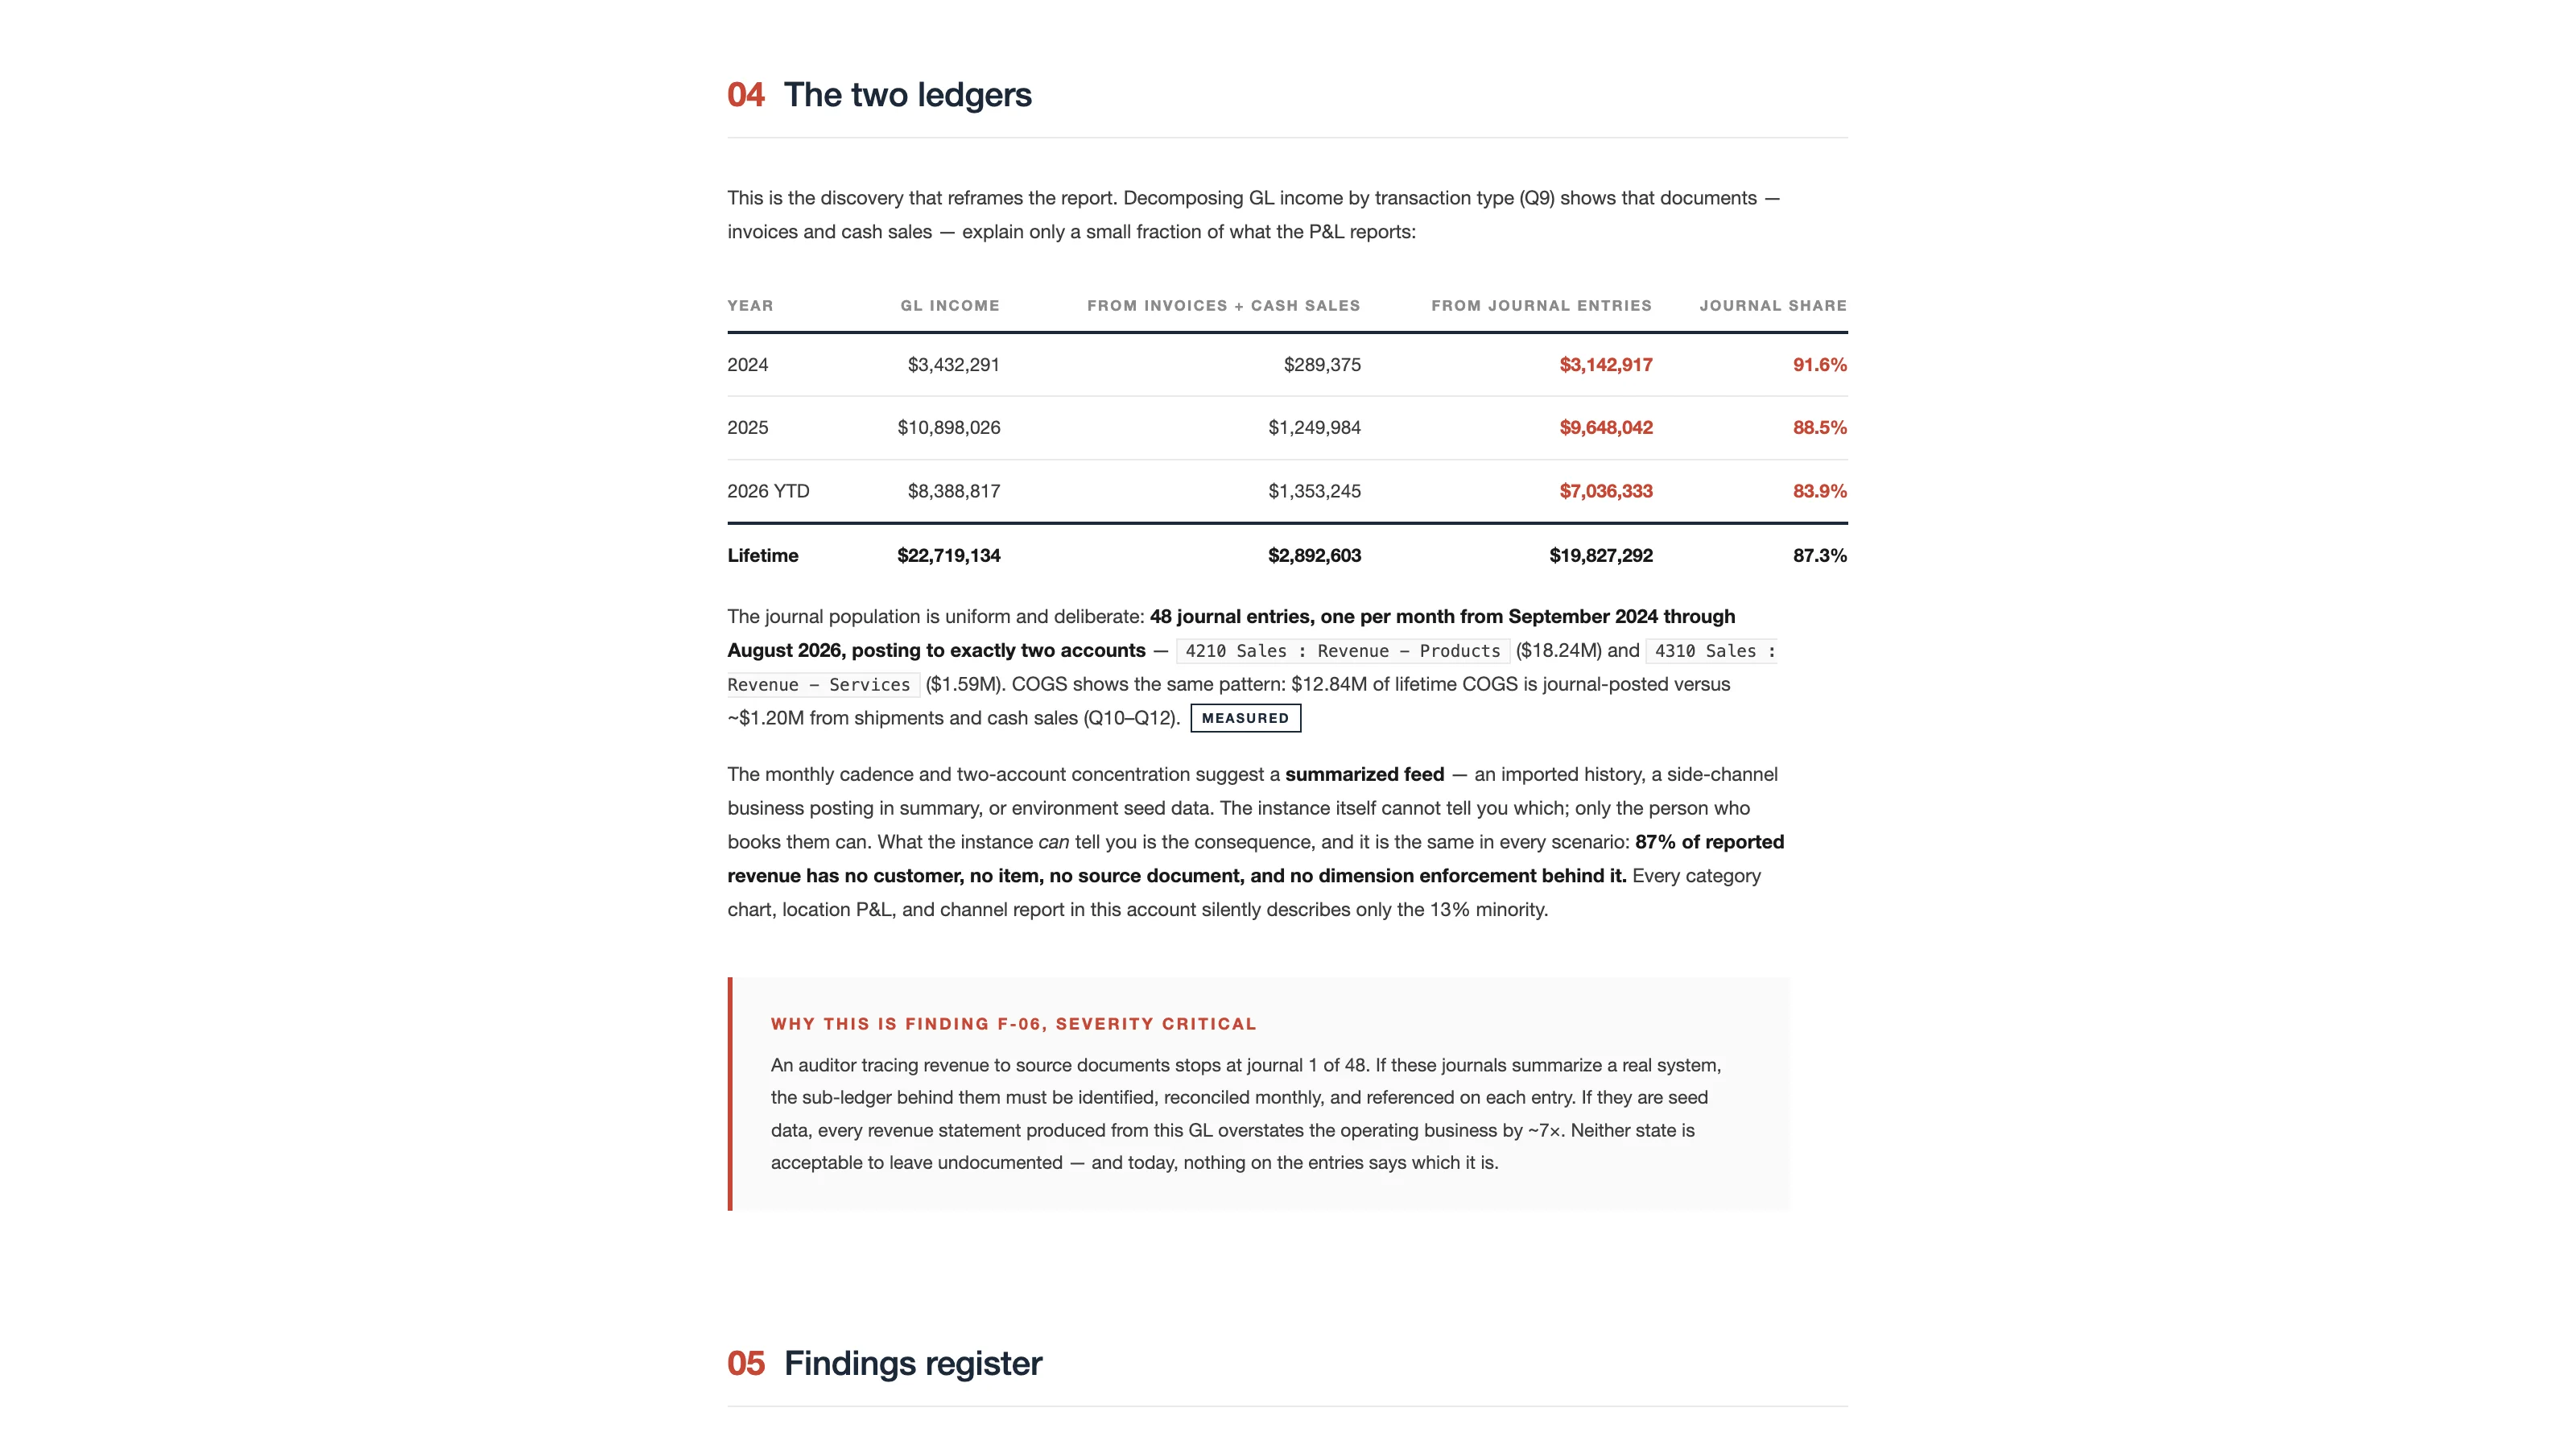
What I appreciate about the way the report handles this is that it refuses to guess what the journals are. The monthly cadence and the two-account concentration suggest a summarized feed, an imported history, or seed data. The instance can't tell you which. Only the person who books them can, and the report says so. What the instance can tell you is the consequence, and it's the same in every scenario: every category chart and location P&L in the account describes only the 13% minority. This is finding F-06, and it's Critical, because an auditor tracing revenue to source documents stops at journal one of 48.
Receivables discipline broke under wholesale growth. Of $928K open, 86.1% is past due. Thirteen invoices totaling $472.9K are aged beyond 90 days. The oldest is 510 days overdue. The 180-plus bucket is 2.4 times the size of the current bucket, which the report describes as inverted from healthy. Inferred DSO is about 171 days, and the derivation is right there on the page: open receivables divided by year-to-date invoice revenue per day, with a note that a proper rolling DSO would need monthly snapshots the instance doesn't keep. Wholesale on net-30 or net-60 terms should be running 30 to 60 days.
Concentration compounds the receivables problem, by name. Ten customers hold 65.9% of lifetime wholesale revenue. Two of them, Global Information and Red Rivers Consulting, are also the two largest overdue balances, at $110,579 (266 days late) and $102,906 (159 days). Five accounts individually owe more than $80K overdue. Eight of the ten largest open balances are 100% overdue, and each one is a single large invoice. If you read the customer concentration post, then you'll recognize some of those names. Red Rivers Consulting was one of the one-invoice whales. It turns out that the one invoice is also 159 days past due.
Below those three sit the governance findings. Four vendor records have plaintext credentials stored in a custom field, readable by any role with vendor view access, first flagged three weeks before this run and still there. The GL-impacting Cost Center segment is populated on zero of 64,466 transaction lines. About 27% of transactional revenue has no product class and about 26% has no location. And none of the seven custom segments is a balancing segment, which the report calls a stated boundary today that becomes a Critical defect the day any dimension is promised its own balance sheet.
The Order to Fix Things In
Six items, sequenced. Identify the 48 journals first, because every other number in the company's reporting inherits the answer. Then a collectability review of the 13 invoices over 90 days, drafted for controller approval with nothing auto-posted. Then a credit policy for the top ten, with new shipments held on any account carrying a 90-plus-day balance. Then credential remediation, which is hours of work: migrate the four values to NetSuite API Secrets, clear the field, retire it. The dimension work comes last, and the report gives the reason. Tagging a ledger whose majority revenue is journal-posted delivers less than fixing the journals first.
I think that the ordering rationale is the most useful paragraph in the report. Most diagnostic tools give you a list. This one tells you why the list is in the order it's in.
How It Caught the Big One
The journal finding wasn't in the plan. The prompt measured GL income and cost of goods by year for the margin table, and separately measured transactional revenue by year, and for 2025 the two numbers were $10.9 million and $1.25 million. That failed a reasonableness test. The prompt's rule is that a discrepancy between two measurements is a finding in waiting and never something to average away, so it decomposed GL income by transaction type, and F-06 fell out.
That's the behavior I most want from a diagnostic. It didn't know what it was looking for. It noticed that two numbers that should have agreed didn't, and it kept pulling.
Everything is in Appendix A: fifteen SuiteQL queries, reproduced verbatim, that rerun as-is against any account. Six stated assumptions each come with what would confirm them. The run was read-only, with no records created or changed, and every remediation is drafted for approval rather than posted.
Wrapping Up
The Ledger X-Ray ran against the same account and found the same 48 journals, and the two reports are meant to be read together. The X-Ray tells the story. The Diagnostic is the findings register and the fix list, and it's the one I'd hand to whoever has to do the work.
The Instance Integrity Diagnostic is in the free tier of the library, so there's nothing to buy. The full sample report from the test account is online, and I covered the whole September release in a separate post.
Run it before the other reports. On the test account, the other reports were describing 13% of the company.