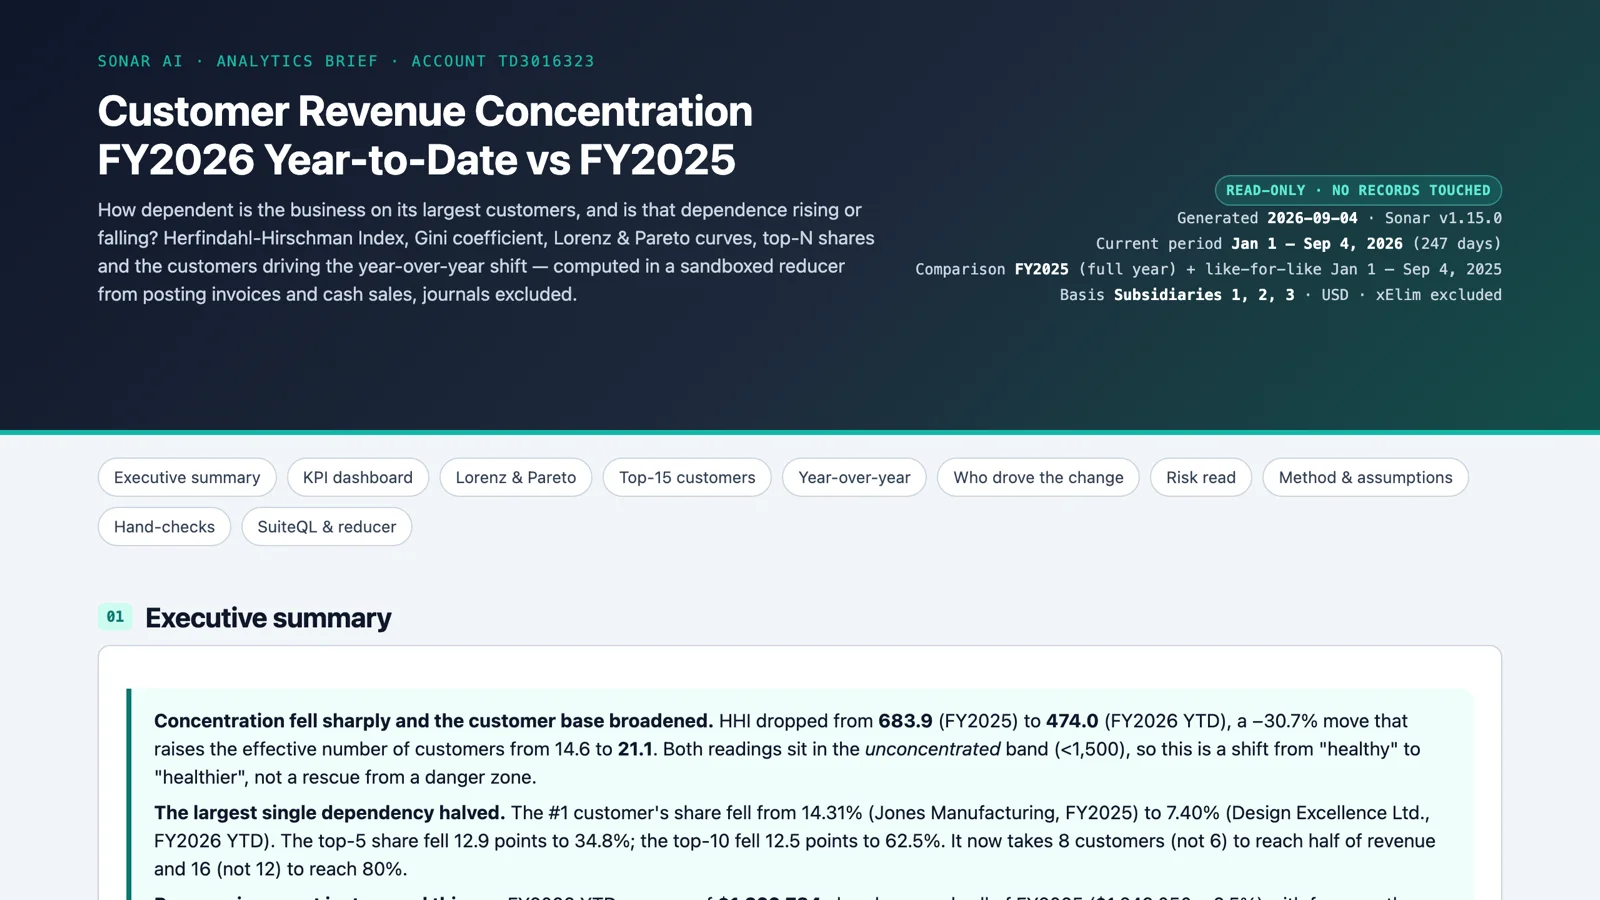
In my NetSuite test account, the second-largest customer of the year sent exactly one invoice. So did the fourth-largest, and the seventh. Between them, those three accounts were 19.7% of year-to-date revenue, and nothing in the account suggests that any of them will be back. Last year had four customers just like them. This year, all four went to zero.
A top-ten customer list won't tell you that. It will show you the same three names near the top, with big numbers beside them, and it will look like a good year. That gap is the reason that I built the Customer Revenue Concentration prompt, and it's why I wanted to give it a post of its own. It went into the Sonar AI Prompt Library yesterday as one of four new free prompts, and I covered it briefly in the post about that release.
If you're new to this, Sonar AI is an AI agent that runs inside NetSuite. Every prompt in the library is a playbook that I engineered and tested against live NetSuite data, and you run it inside your own account, against your own records. Nothing leaves the account, and nothing is written to it.
The Question It Answers
How dependent is the business on its largest customers, and is that dependence rising or falling? Most finance teams have a feel for the answer. They know who the big accounts are, and they'd be nervous if one of them left. What they usually don't have is a number for it, or a fair comparison to last year that names which customers moved that number.
The prompt gives you all of that. The headline metric is the Herfindahl-Hirschman Index (HHI), which is the sum of every customer's squared revenue share, scaled to 10,000. A single customer with all of your revenue scores 10,000. A hundred equal customers score 100. The prompt applies the bands that the U.S. Department of Justice and the Federal Trade Commission use for merger review, where anything under 1,500 is unconcentrated, 1,500 to 2,500 is moderate, and above 2,500 is highly concentrated, and it notes that for a customer book a reading above about 1,000 is where explicit key-account risk management starts to earn its keep.
The number that I find most useful is the one derived from it: the effective number of customers, which is just 10,000 divided by HHI. It's how many equal-sized customers would produce the same concentration. Revenue that "behaves as if" it came from 21 customers is a very different business from one that behaves as if it came from 6, even if both have a hundred names in the customer list.
Around those two sit the rest: the Gini coefficient and a Lorenz curve for how unequal the whole base is, a Pareto curve for the classic "what share of customers gives what share of revenue" reading, the top-1, top-5, top-10, and top-20 shares, and the count of customers it takes to reach 50% and 80% of revenue. All of it is computed for the current year and the prior year, and the prior year is computed twice.
That second computation matters. If you run this in September, then comparing year-to-date against all of last year overstates last year. So the prompt also builds a like-for-like window, January 1 through the same day in the prior year, and shows both. In my NetSuite test account, every concentration metric moved in the same direction and by a similar magnitude on both bases, which is what tells you that the conclusion is real and not a calendar effect.
What It Found on the Test Account
Concentration fell, and it fell a lot. HHI dropped from 683.9 for FY2025 to 474.0 for FY2026 year-to-date, a 30.7% move, and the effective customer count rose from 14.6 to 21.1. The largest single dependency halved: the top customer was 14.31% of revenue last year (Jones Manufacturing) and is 7.40% this year (Design Excellence Ltd.). The top five went from 47.7% of revenue to 34.8%. It now takes 8 customers to reach half of revenue instead of 6, and 16 instead of 12 to reach 80%. Both years sit in the unconcentrated band, so this is a move from healthy to healthier.
And revenue is up, so the base didn't just spread thinner. FY2026 year-to-date revenue of $1,329,784 already exceeds all of FY2025 ($1,249,050) with four months still to go. Against the like-for-like window it's up 82.6%.
Then the report does the thing that I most wanted it to do, which is refuse to stop there. The Gini coefficient barely moved, from 0.774 to 0.759. The bottom half of customers still produce 4.4% of revenue, and 19 customers under $1,000 contribute 0.85% combined. Concentration fell because 29 new customers arrived and contributed 40.2% of year-to-date revenue, and most of them landed in the middle of the distribution. The long tail is still a long tail. If someone on the team has been running a small-account acquisition program, then this is the report that tells them it isn't moving the needle yet.
The "who drove the change" section attributes the HHI move to individual customers, and it reads like a story. Jones Manufacturing going from 14.31% to 6.88% accounts for 157.5 points of the 209.9-point drop, three quarters of the entire move on its own. Global Information, last year's number three at 8.15%, went to zero and contributed another 66.4 points. Running the other way, Red Rivers Consulting appeared out of nowhere at 7.10% and added 50.4 points back. Marshall Industries grew 150% and climbed from fifteenth to ninth. The cohort bridge underneath it shows 69 retained customers at $795,785, 29 new customers at $533,999, and 8 lost customers who took $286,016 with them, which was 22.9% of last year.
Retained customers are running at 82.6% of their FY2025 total with a third of the year left, so they're on pace to roughly match. The growth is almost entirely new logos.
The One-Invoice Whales
I think that this is the part most concentration analyses get wrong, and it's the reason the prompt tags transaction counts everywhere it lists a customer.
Red Rivers Consulting, Magna Tech Limited, and Falcon Systems are the number two, four, and seven customers for the year, at $94,370, $89,343, and $78,456. Each of them is a single transaction. Add John G. Roche Opticians, also one invoice at $29,939, and four invoices are $292,108, or 22.0% of the year.
Now look at last year. Global Information, Mercury Co., Gotter inc., and Haskell Associates were the single-invoice customers in the FY2025 top twelve, and together they were 22.5% of that year. Every one of them produced zero revenue in FY2026. If the pattern holds, then roughly a fifth of this year's revenue is non-recurring by construction, and the retained-customer base underneath it is roughly flat.
A customer who sends fifteen invoices over eight months has a relationship with you. A customer who sends one might have a relationship with you, or might have had a one-time project, or a purchasing manager who has since left. On a ranked customer list, the two look identical. The prompt flags every single-transaction customer in the top-15 table and again in the cohort bridge, and its first suggested next step is to get those four accounts in front of someone before Q4. A second order from any one of them changes the recurring revenue picture materially.
The other suggested steps are the kind that I'd want a standing review built around. Re-run the analysis at fiscal year close, and if HHI stays under 600 and the top-5 share under 40%, then the diversification is structural rather than a timing artifact. Track effective customer count as a standing metric alongside top-10 share, since it's the one number that captures both. And re-cut by class or subsidiary, because a book that looks diversified in total can be badly concentrated inside one product line.
How the Numbers Are Built
I care as much about whether the numbers can be trusted as about what they say, so the prompt spends real effort on that.
Revenue is defined as posting customer invoices and cash sales, taken at the line level, excluding mainline and tax lines, and measured as the absolute value of net amount. Journals are excluded entirely. On the test account that decision has consequences: roughly 86% of general ledger revenue lives in monthly "Beg Balance Entries" journals that are synthetic demo data, so the report measures transactional customer revenue and says plainly that it won't tie to the income statement. I'd rather a report tell me that than tie to the ledger by counting journal revenue against nobody.
Before it computed anything, the prompt ran a pre-flight on the customer hierarchy. Of 274 customer records, exactly one has a parent, and the hierarchy is one level deep, so a single-level roll-up to the parent is exhaustive. In both periods that roll-up affected zero rows, because the one child customer had no revenue, but the reducer applies the rule anyway and reports member counts, so it will do the right thing if hierarchies get added later. It also ran a sign audit across every included line, found no positive lines in either period (0 of 1,800 this year, 0 of 2,493 last year), and concluded that the absolute value was safe. Credit memos aren't netted, and the caveats say so and tell you how to add them if you want net revenue.
The math runs in a sandboxed reducer. The SuiteQL queries pull the rows, a JavaScript reducer computes every metric, and only the reducer's summary ever reaches the model. The rows themselves never enter its context. Then the report checks its own work: shares sum to 100.000000% in both periods, top-15 revenue plus the residual equals the total to the cent, HHI of the top 15 plus HHI of the residual equals the reported HHI, and the cohort bridge adds up. There's even a manual spot-check where the HHI is recomputed by hand from the rounded shares in the published table, and it lands within rounding of the reducer's value. Every query and the full reducer are printed verbatim in an appendix.
It's read-only. No records are touched.
Wrapping Up
I built this prompt as the customer-side counterpart to the Vendor Concentration and Single-Source Risk prompt that I wrote about in June. Same index, same bands, opposite side of the ledger. Together they answer the two dependency questions that a lender or a buyer will ask before almost anything else.
Customer Revenue Concentration is in the free tier of the Sonar AI Prompt Library, so there's nothing to buy. The full example report from the test account is online if you want to see every section, including the appendix.