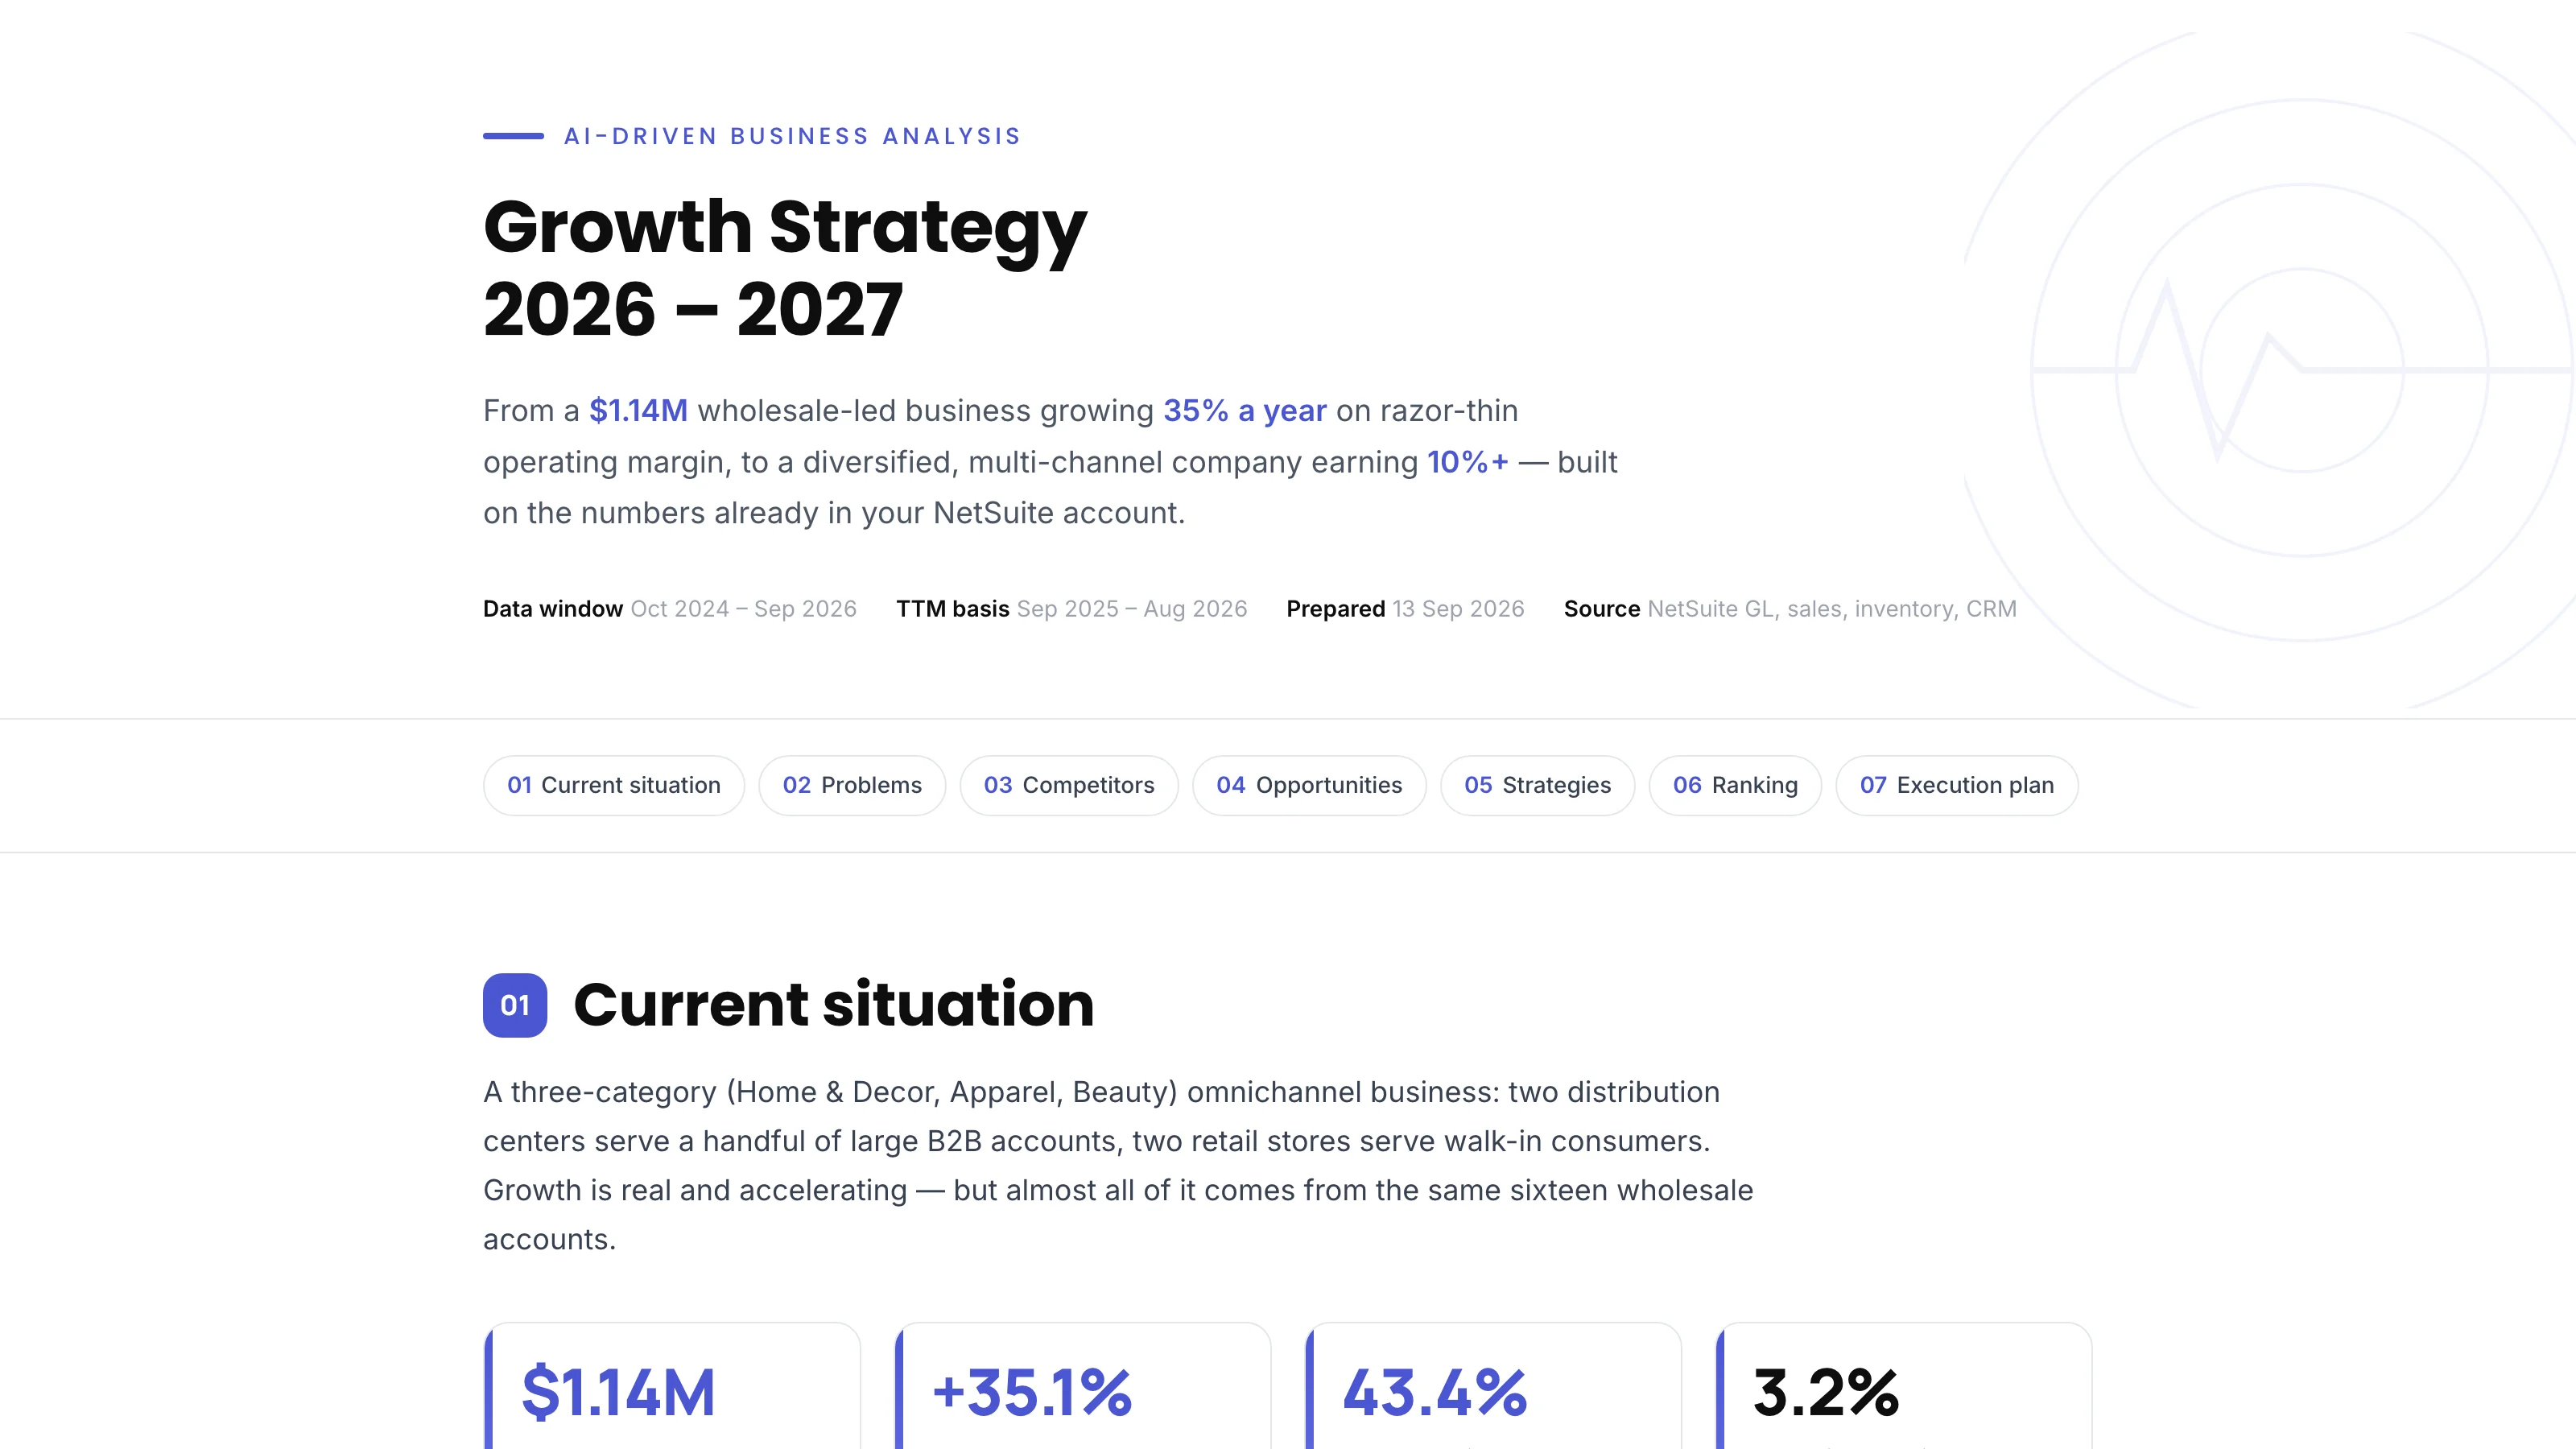
My NetSuite test account describes a business growing 35% a year on a 3.2% operating margin. Sixteen wholesale accounts served from two distribution centers produce 88% of revenue. The two retail stores process 86% of all transactions for 12% of revenue, at the best margins in the company. Sixty-seven customers first bought in 2024, two in 2025, and eleven so far in 2026. A Chicago distribution center has a building, an inventory location, and $42,500 of stock, and has never shipped an order.
The Business Growth Strategy prompt reads that account and writes a two-year plan from it. It went into the Sonar AI Prompt Library in September. If you're new to this, Sonar AI is an AI agent that runs inside NetSuite. Every prompt in the library is a playbook that I engineered and tested against live NetSuite data, and you run it inside your own account, against your own records. Nothing leaves the account, and nothing is written to it.
The Situation, on a Clean Basis
The current-situation section starts by excluding two synthetic sources from the ledger: 33 invoices with a TEST memo prefix worth $764,000 and the monthly opening-balance journals. With them in, reported revenue would be 36% higher and receivables over ninety days would show $473,000 that isn't collectible. Every figure after that is on the clean basis, and the report says so in a footnote under the first chart.
What's left is $1.14 million of trailing revenue, up 35% on the prior year, gross margin in a stable 41 to 48% band every month, and $37,000 of operating income. Advertising is $247,000, which is 21% of revenue and half of operating expense, and 98% of operating expense is coded to the sales department. The report describes it as two businesses on one profit and loss statement, wholesale with 252 orders averaging $7,600 and retail with 1,549 orders averaging $175.
Eight Problems, Ranked by Risk
Two critical. Customer concentration, where the top five customers are 56% of revenue and losing the largest alone would erase all trailing growth in a quarter. And stalled acquisition, where 193 of 273 customer records have never transacted and the open pipeline is ten opportunities worth $15,000. Growth is entirely wallet share from existing accounts.
Three high. Advertising spend that can't be tied to anything, because the CRM carries no campaign, lead-source, or promotion attribution. A coverage gap where 66 buying customers worth $152,000 have no sales rep while three reps cover sixteen accounts. And $1.12 million of inventory against $628,000 of annual cost of sales, 1.8 turns, with 206 of 338 items never sold.
Three medium: the idle Chicago, third-party logistics, and Amazon fulfillment locations, sub-scale store economics with a 2.8-unit basket and no loyalty data, and the data hygiene that makes every raw dashboard overstate revenue by a third.
Competitors, Inferred
NetSuite holds no competitor data, and the report says so. What it does is infer four archetypes from the product categories, vendor list, and channel structure, and name illustrative examples of each: national furniture and bedding distributors who are already the top three vendors and have begun selling direct, online marketplaces where the company is absent despite having an Amazon location configured, direct-to-consumer mattress brands compressing margin on the largest product family, and off-price retail on apparel and beauty. The positioning map has two rows marked "none" for the company, digital presence and customer data, and the report says those are the ones to fix first because they're where competitors are strongest.
Six Strategies and a Ranking
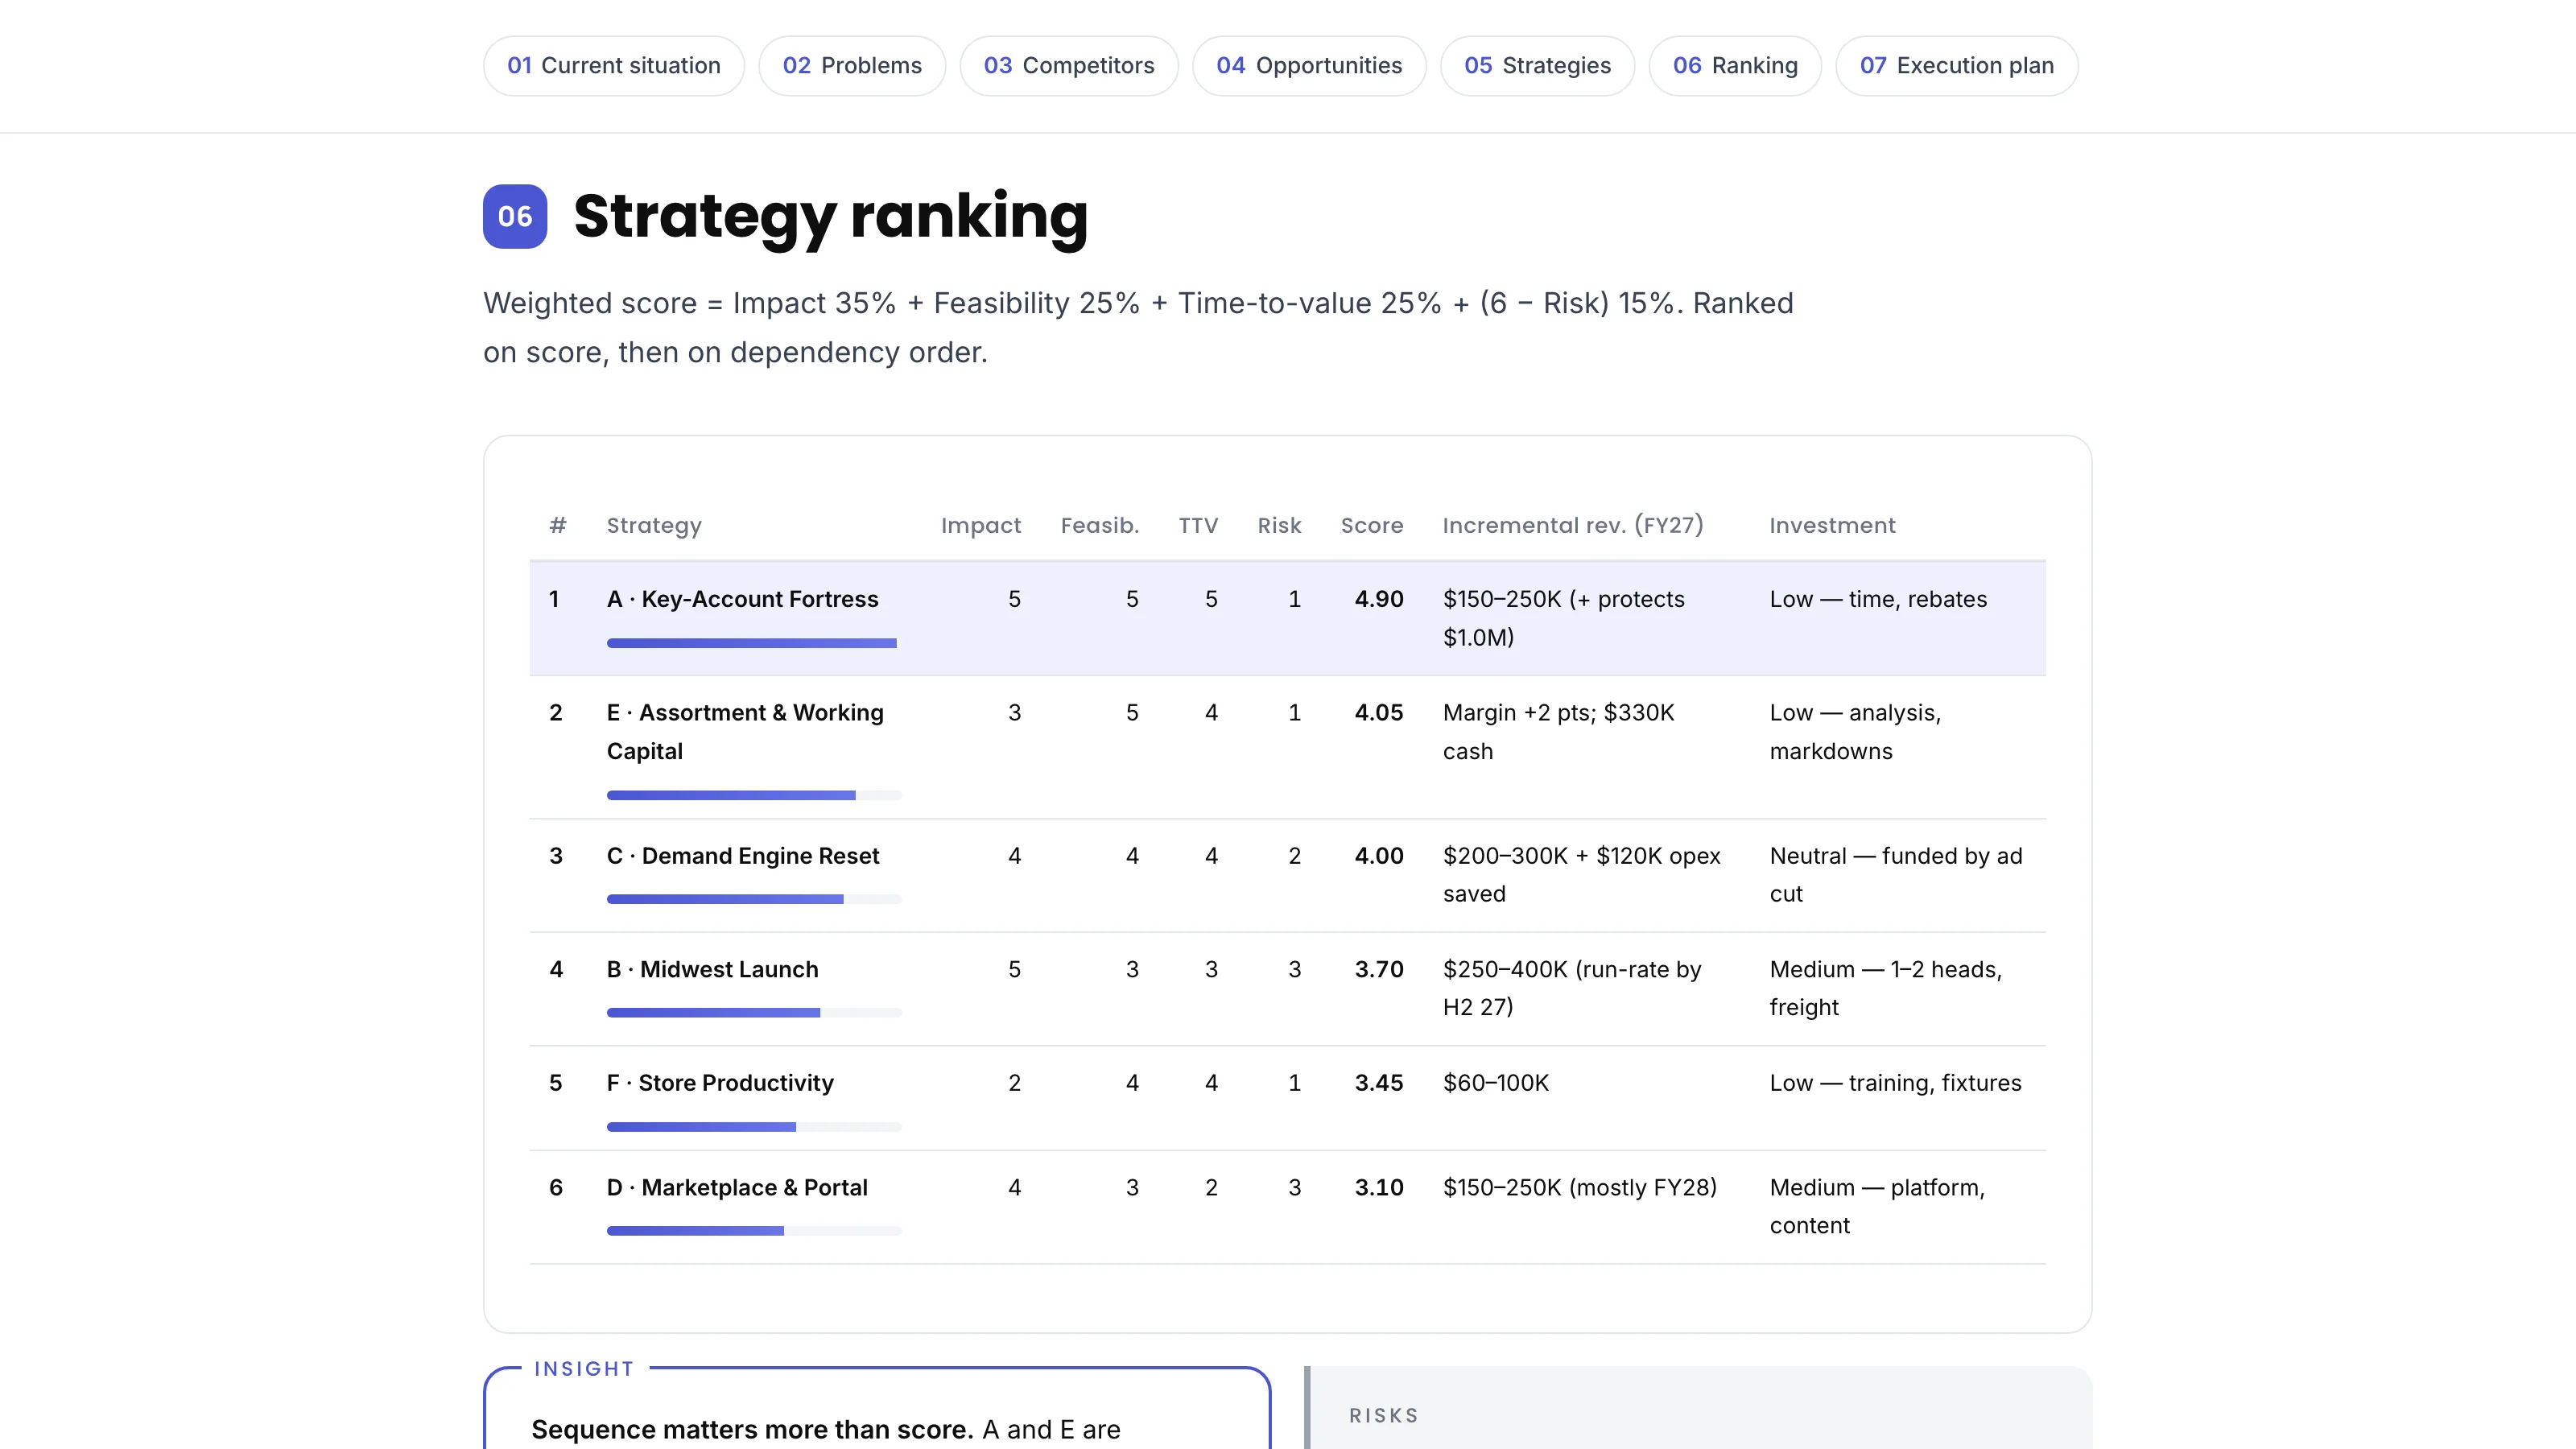
Each strategy is scored one to five on impact, feasibility, time to value, and risk, and mapped to the problems it fixes. The weighted ranking puts a key-account program first at 4.90, assortment and working capital discipline second, a demand-engine reset funded by cutting advertising in half third, the Chicago launch fourth, store productivity fifth, and marketplace and portal sixth.
Then the report says something a scoring table can't: sequence matters more than score. You can't open Chicago while Los Angeles carries 140 back-ordered units and Chicago inventory is unmanaged, and you can't fund acquisition without first re-basing advertising. The first three are cheap and fast and de-risk everything after them.
The Chicago recommendation rests on what the report calls the most repeatable asset in the company: the Miami model, four anchor accounts and one distribution center producing $718,000 in 23 months. The play is to run it a third time with stock rebalanced from slow Los Angeles and San Francisco positions rather than new purchases, gated on two signed letters of intent before any transfer.
The Execution Plan
Four phases over fifteen months, each with an owner, a deliverable, and a KPI that can be read from NetSuite. Phase zero is thirty days of cleaning the instruments: void or reclassify the test invoices, assign a rep to every buyer, schedule reviews with the top ten, freeze advertising at half. The scorecard at the end lists nine KPIs with today's value, three checkpoints, and the NetSuite source for each, from clean monthly revenue by memo filter to Chicago lines by location.
The exit targets for 2027 are $1.6 million of revenue, top-ten share under 65%, forty new logos, three inventory turns, and a 10% operating margin. The report calls that conservative, given the assets already owned.
Wrapping Up
The Customer Revenue Concentration post covers the first problem on this list in depth, and the Inventory Two-Way Grading prompt prices the fifth.
Business Growth Strategy is in the paid tier of the library. The full sample report from the test account is online, and I covered the whole September release in a separate post.
Growth wasn't the problem on the test account. Concentration, cost to acquire, and unused capacity were, and all three were fixable with what the company already owned.