Thirty of the 366 prompts in the Sonar AI Prompt Library are free. If you're new to Sonar AI, that's where I suggest starting. There's nothing to buy, and the free tier isn't a sampler of weak prompts. It includes some of the ones I show people first.
This post is a tour of all thirty, grouped by the question each one answers. A few of them have their own posts, and I've linked those. The rest get two or three sentences each, which is enough to know whether it's the one you need today.
If you're new to this, Sonar AI is an AI agent that runs inside NetSuite. Every prompt in the library is a playbook that I engineered and tested against live NetSuite data, and you run it inside your own account, against your own records.
How Is the Business Doing?
Enhanced Balance Sheet takes NetSuite's standard comparative balance sheet and turns it into a position analysis: common-size variance columns, a 21-ratio cross-statement suite, DuPont return on equity, and a derived cash-flow bridge that has to reconcile to the penny. The bridge is the part that proves the rest. It has its own post.
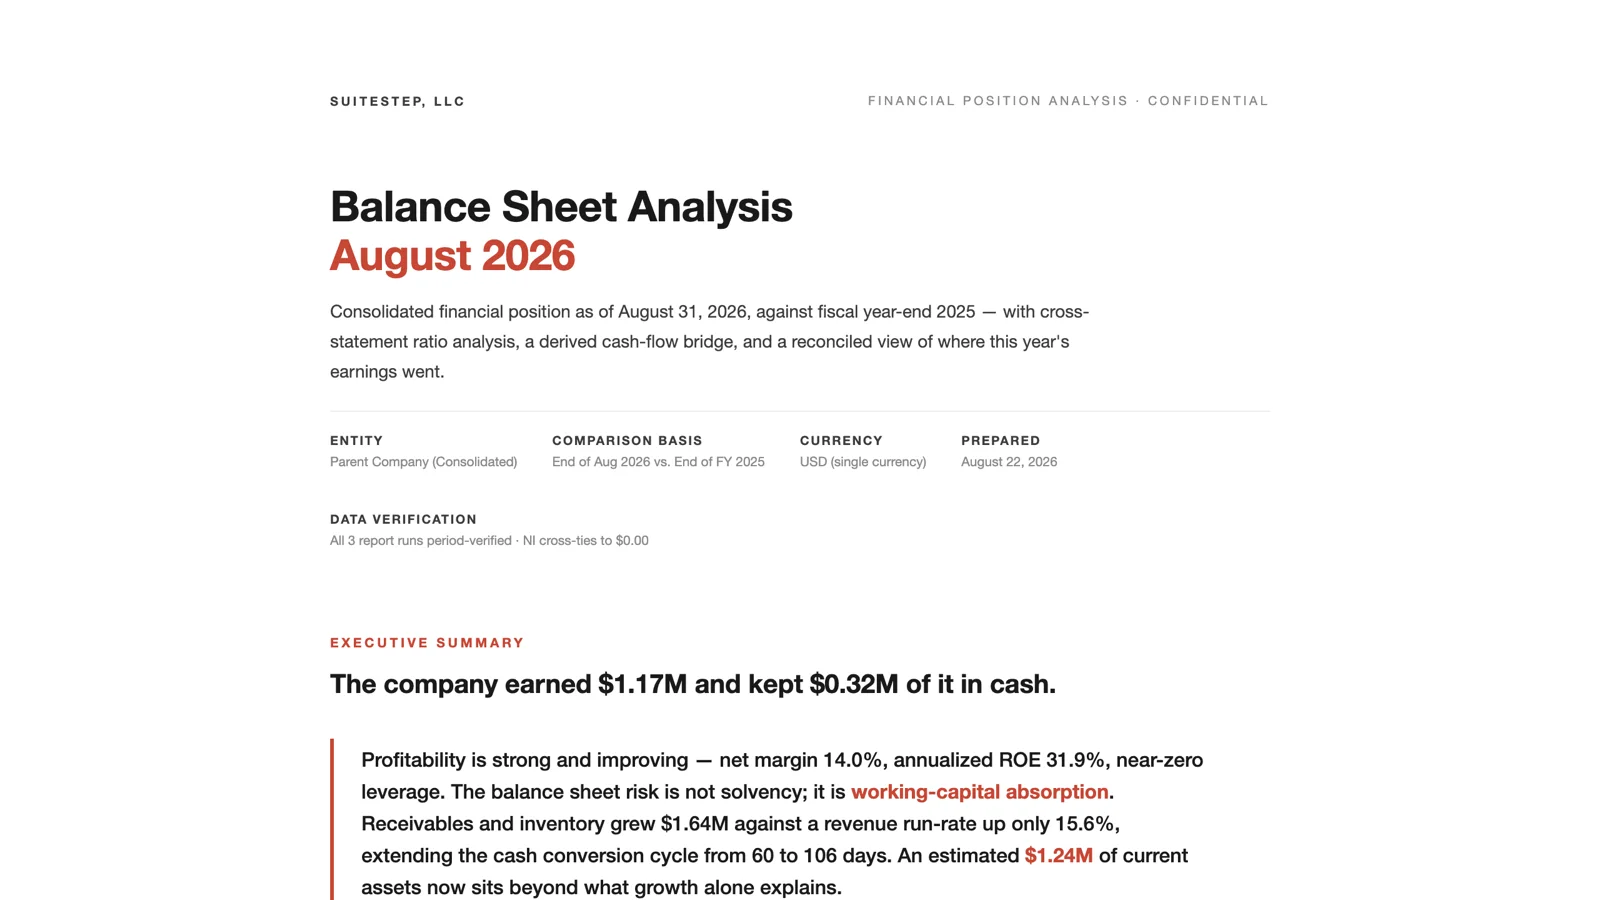
Sample report: Enhanced Balance Sheet.
Financial Performance Overview is a board-ready single-period overview built entirely from NetSuite's standard reports, with a segment breakdown, prior-period and prior-year benchmarks, health ratios, and risk indicators. Executive Summary Creator is its lightweight cousin: a one-page summary of key highlights and commentary, the quick version of the paid Board Meeting Executive Summary.
Financial Ratio Analyzer calculates and interprets the liquidity, profitability, efficiency, and leverage ratios. Trial Balance Analyzer checks the trial balance for anomalies, errors, and close readiness, and gives it a quality score.
P&L Flux Analysis with Automated Variance Explanations is a full-population flux analysis for any two periods: account-level variance ranking, transaction-level driver attribution, price, volume, and mix decomposition of revenue, and a reported-versus-normalized P&L. It's covered in the post on forecasting and variance.
Sample report: P&L Flux Analysis.
Where Is the Cash?
Money Flow Sankey renders the whole P&L as a river: revenue streams flowing through gross margin into operating expense categories and net income, as an interactive Sankey diagram. It's the prettiest thing the library produces, and it costs nothing. It appears in the post on executive dashboards.
Cash Flow Forecast Generator builds detailed forecasts with scenario modeling and a liquidity risk assessment. Working Capital Analyzer breaks working capital into its components with trend analysis and optimization recommendations, and DSO/DPO/DIO Calculator & Advisor computes the three working-capital metrics with benchmarks and an improvement plan.
AR Aging Analysis & Commentary produces the aging analysis with collection priorities and the management commentary to go with it.
Where Does the Revenue Come From?
Sales Growth Opportunity Audit is a full-spectrum audit of sales trends, pipeline, customers, inventory, and pricing that surfaces ranked, dollar-quantified growth opportunities. Seven of them, ranked by speed to cash, each with a named, deep-linked work list: dormant customers, one-time buyers, stalled estimates, slow movers. It has its own post.
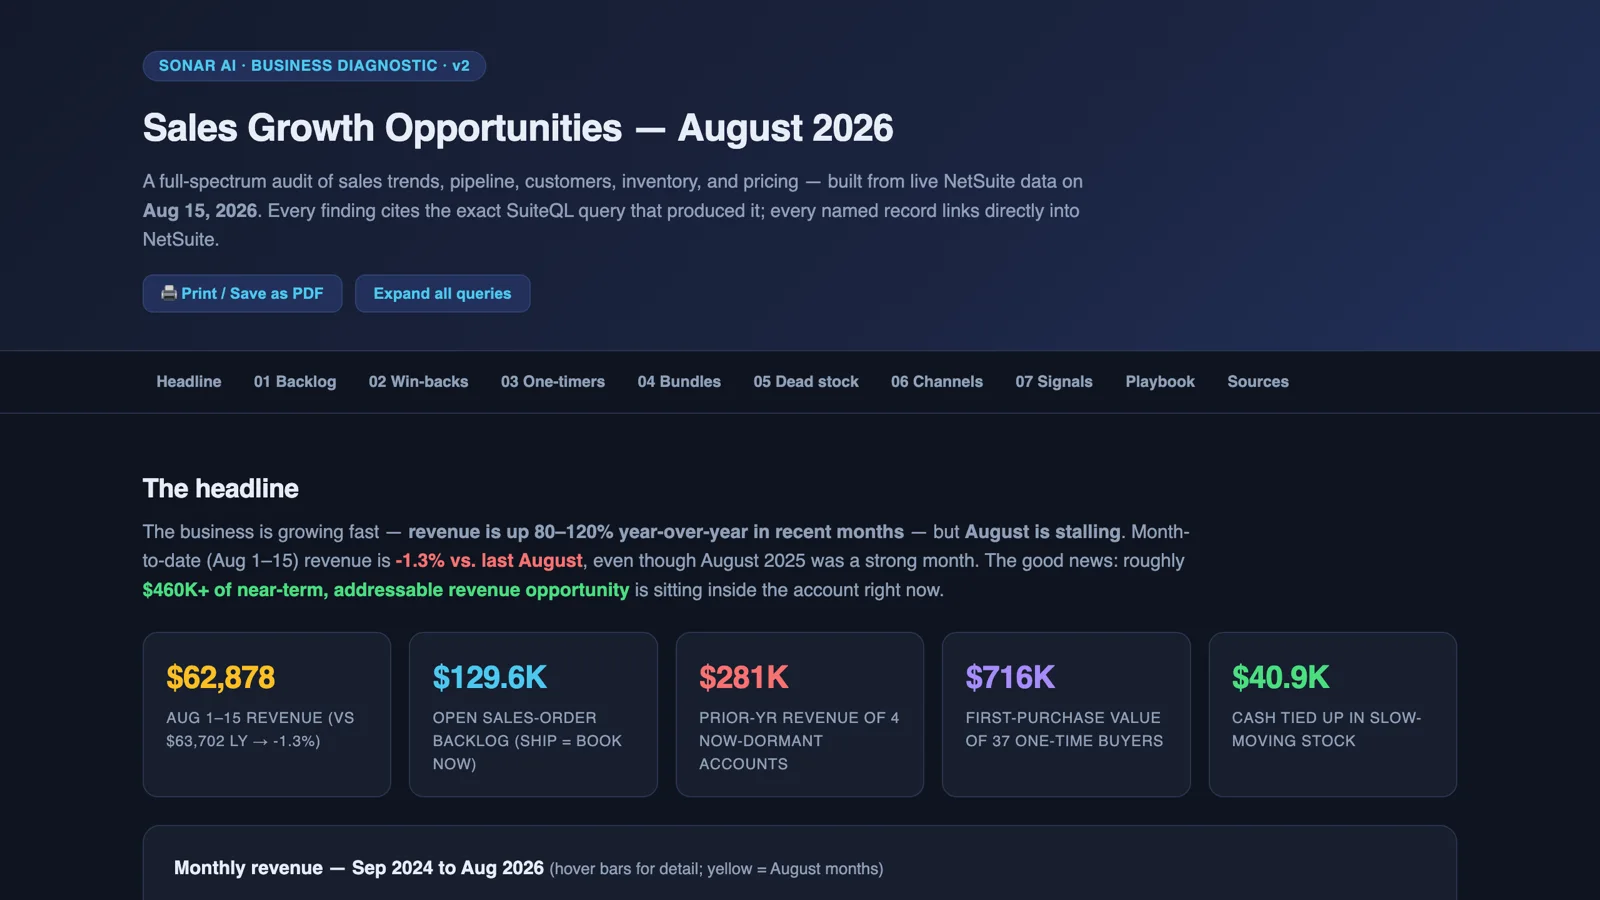
Sample report: Sales Growth Opportunity Audit.
Revenue Treemap Builder is the category-to-item treemap, sized by revenue, gross profit, or units and colored by margin or growth, with click-through to the item record. Revenue Trend Analyzer covers growth mechanics: segmentation, seasonality indices, price, volume, and mix decomposition, anomaly detection, and bear, base, and bull projections.
Customer Profitability Analyzer works out customer-level profitability with cost-to-serve and margin analysis. Sales Calendar Heatmap Generator draws a GitHub-style daily sales heatmap that shows seasonality, weekday patterns, outlier days, and data-quality artifacts. And Customer Revenue Bar Chart Race Generator animates the top customers by cumulative revenue, so you can watch ranks shift and compounders climb.
What Is It Costing Us?
Budget vs Actual Variance Analyzer compares budget to actuals with trend, drill-down, and corrective action recommendations. Expense Trend Identifier finds expense trends, seasonality patterns, and cost anomalies across the P&L. Vendor Cost Analyzer looks at vendor costs, price trends, and cost reduction opportunities by vendor and category.
Is the Inventory Right?
Inventory Risk Grid is one screen with every active inventory item on it, rendered as a heatmap of velocity against weeks of stock. Fast movers about to stock out sit in the red corner. Dead money sits in the blue corner, weighted by the dollars tied up. Hover a tile for the detail, click it and the item opens in NetSuite. In one of my test accounts it found 106 dead-money items with $631K tied up in them. It's in the supply chain post.
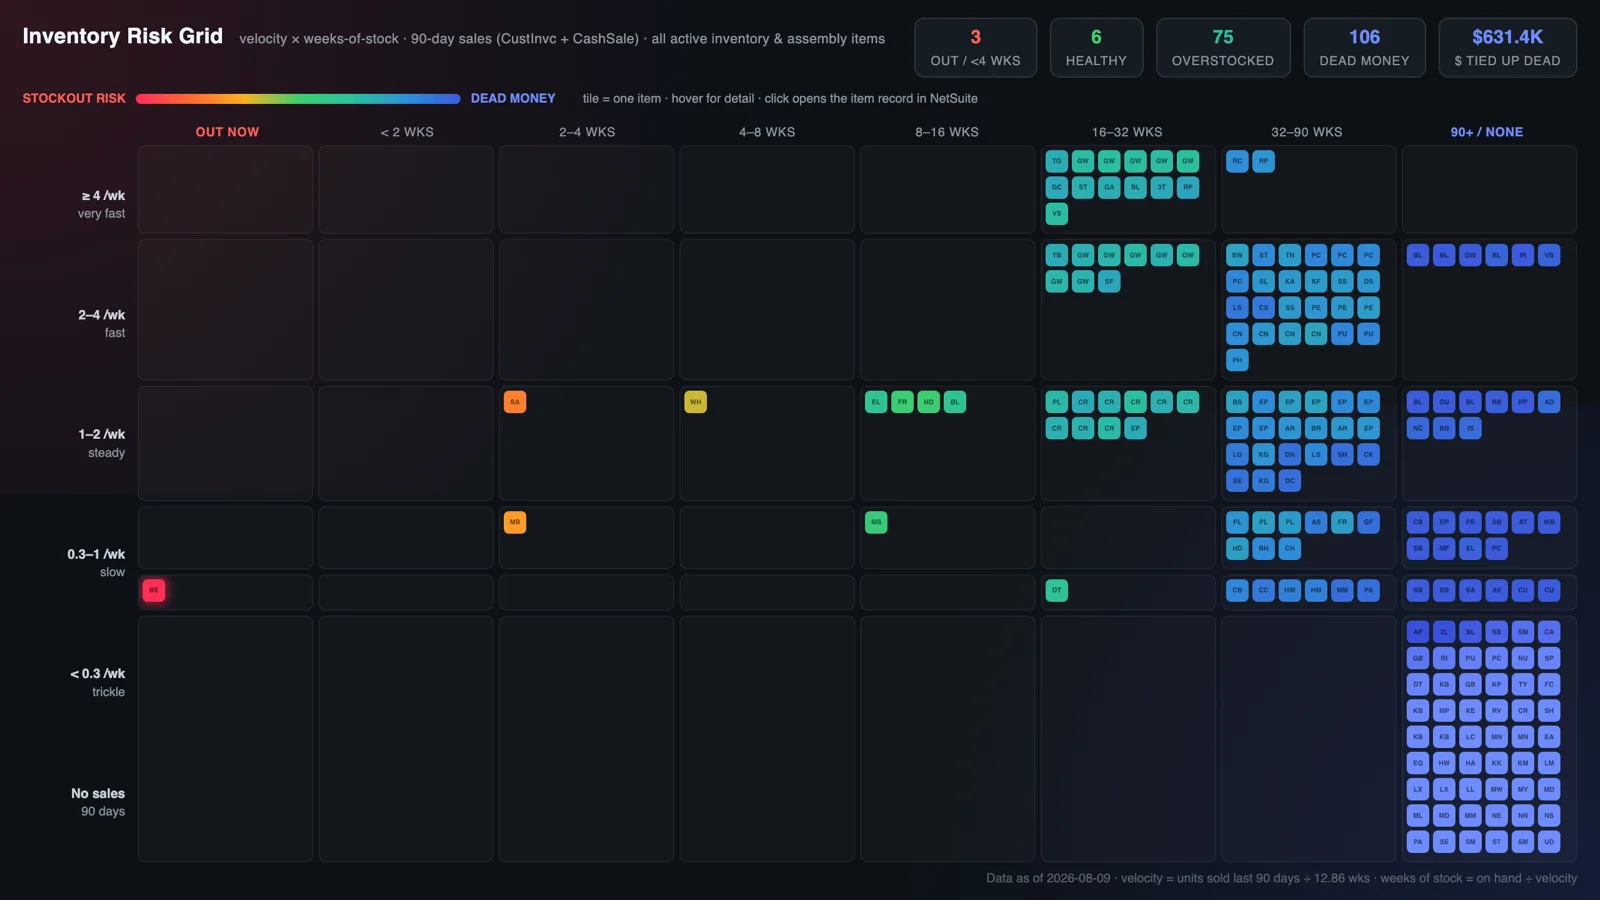
Sample report: Inventory Risk Grid.
Inventory Health Monitor is the narrative version: turnover, coverage, dead stock, and overstock, with disposition recommendations for each.
Is the Close Clean?
Month-End Close Checklist Generator builds a close checklist customized to the account, with dependencies, ownership, and timeline tracking. The checklist generator is covered in the post on close and reconciliation. Journal Entry Reviewer analyzes journal entries for errors, policy compliance, and unusual patterns, with control testing.
Is the Account Itself Healthy?
This is the group that surprises people, because it isn't about the finances at all. It's about the NetSuite account as a system.
Account Configuration Summary is a one-page configuration atlas built from live introspection: enabled features, the subsidiary tree, the fiscal calendar, a user and role census, and utilization signals. Account Data Quality Composite Score runs six cheap, fast probes, for addresses, mandatory-field gaps, broken chains, unapplied cash, dimension tagging, and duplicate names, and normalizes them to a single score from 0 to 100 with pointers to the specialist prompts that fix each one.
Stale Open Transaction Groomer finds every open purchase order, sales order, and estimate that has outlived any plausible fulfillment horizon, ages it, puts a dollar figure on it, and recommends a close-out per document. It's the backlog grooming NetSuite never prompts anyone to do. Both it and the configuration summary are in the post on account hygiene.
Transaction Volume Analyzer looks at volume trends, patterns, and anomalies across every document type. Operational Efficiency Analyzer finds inefficiencies and bottlenecks in the transaction flows.
And NetSuite Administrator Hiring Profile is the odd one out, and one of my favorites. It surveys the account itself, meaning its features, org structure, customization footprint, automation load, and role sprawl, and derives a recruiter-ready hiring profile from the evidence: tiered requirements, interview scorecard weighting, questions grounded in the actual account, and a first-year mandate. It has its own post.
Wrapping Up
The free tier exists because I'd rather people find out what Sonar AI does by running it than by reading about it. Every one of these thirty runs against your own account and your own records, and the reports show their queries, so you can check the work.
You can browse just the free prompts with the library's filter: suitestep.com/sonar-ai/prompt-library/?tier=free. The full Sonar AI Prompt Library holds the other 336, and it's a one-time purchase that covers your whole account family.