Month-end asks three questions, and it asks them in order. What moved? Why did it move? And what happens next? The first is a comparison, the second is a decomposition, and the third is a forecast, and in most finance teams they're answered by three different spreadsheets, if the third one gets answered at all.
I've been working on a set of FP&A prompts for the Sonar AI Prompt Library that follow that chain, and they'll be in the next release. Six prompts, from a flux analysis that reads every posting line in the ledger, through variance ranking and root cause, to scenario forecasting, a rolling cash forecast, and a headcount model. The first of them is free.
If you're new to this, Sonar AI is an AI agent that runs inside NetSuite. Every prompt in the library is a playbook that I engineered and tested against live NetSuite data, and you run it inside your own account, against your own records.
What Moved: P&L Flux Analysis
The P&L Flux Analysis with Automated Variance Explanations is the month-end flux package that every finance team wants and no standard NetSuite report delivers. Not just which accounts moved between two periods, but why, traced to the individual source documents, decomposed into price, volume, and mix, put in the context of the trailing twelve months, and separated into recurring performance and one-time noise.
The first rule is that it reviews 100 percent of posting GL lines. It's a census, not a sample. Every number reconciles to the ledger, every narrative claim cites a document, and every hedge is stated.
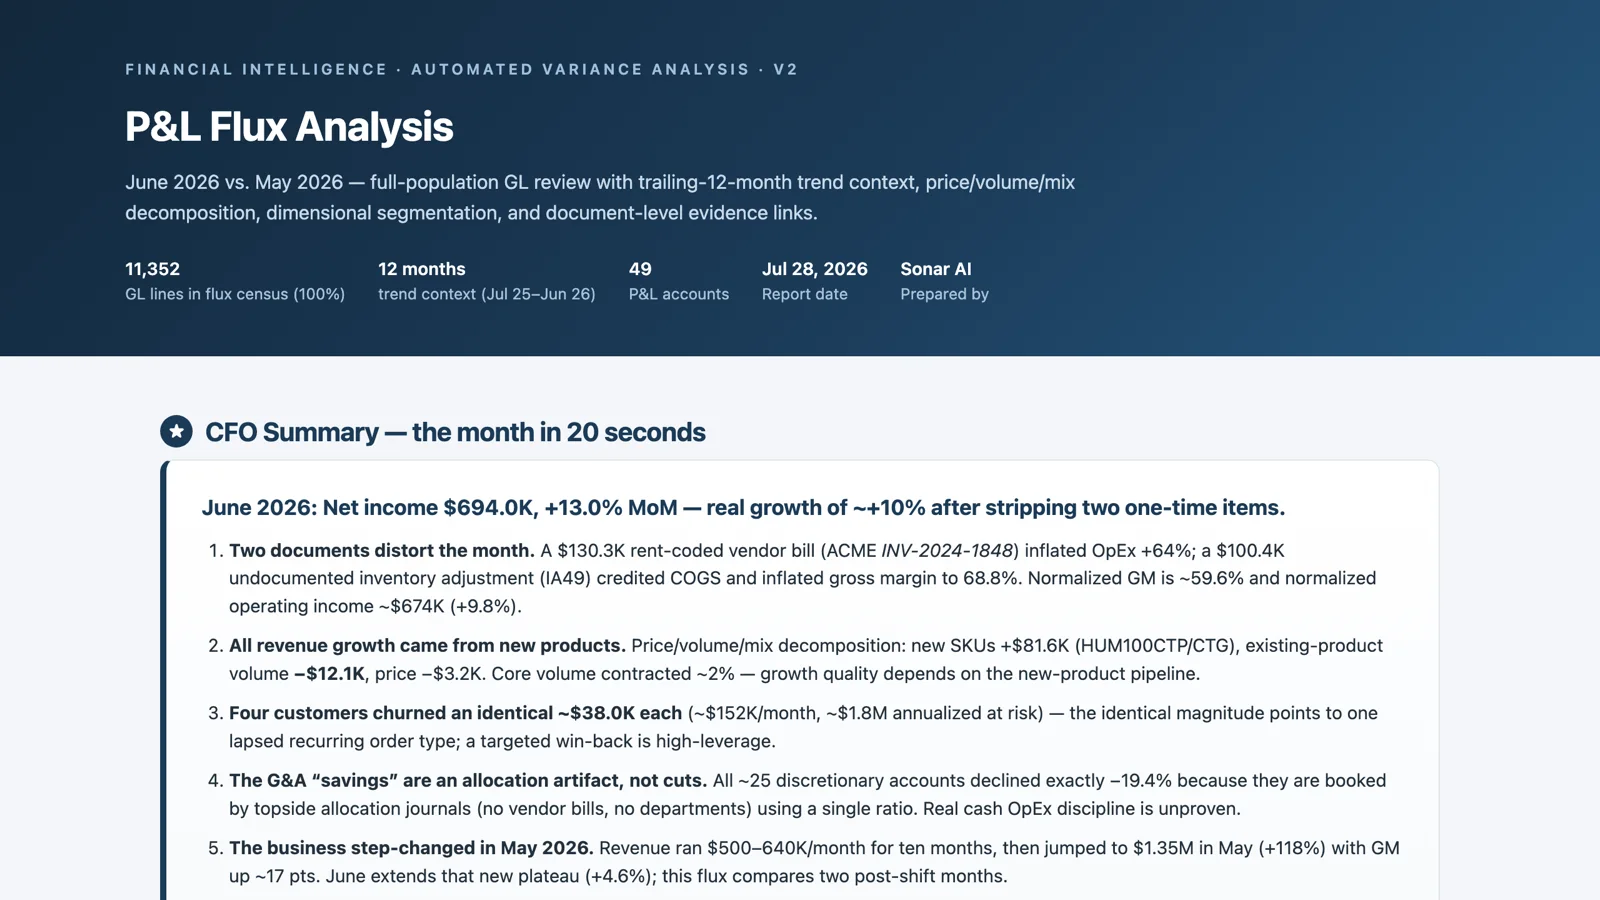
I ran it against one of my NetSuite test accounts for June 2026 against May: 11,352 GL lines across 49 P&L accounts. Net income was $694K, up 13 percent month over month as reported. The report's first finding was that two documents distorted the month. A $130K vendor bill coded to rent inflated operating expenses by 64 percent, and a $100K undocumented inventory adjustment credited cost of goods sold and pushed gross margin to 68.8 percent. Normalized, gross margin was about 59.6 percent and the real growth was closer to 10 percent. Both documents were flagged as priority-one items to resolve before close, with links.
The rest of the summary is the kind of thing that takes a good analyst a day. All of the revenue growth came from new products, and existing-product volume actually contracted. Four customers churned an identical amount each, which points to one lapsed recurring order type rather than four unrelated losses. The apparent savings in general and administrative expense were an allocation artifact, because about 25 discretionary accounts had declined by exactly the same percentage, which happens when they're booked by a single top-side allocation ratio. And the trend view showed that the business had step-changed in May, from a ten-month plateau of $500K to $640K a month to $1.35M, so the flux was comparing two post-shift months. A two-month comparison can't see that. The trailing twelve can.
This one is free. You can see the report from this run here: P&L Flux Analysis: June 2026 vs. May 2026.
What Moved Against Plan: QTD Budget Variance
The QTD Budget Variance Analysis is a ranked exception report, not a P&L recital. It compares actuals to budget for the quarter to date and identifies the top five variances by dollar impact, with the percentage alongside, across revenue, operating expenses, and net income. Each one gets an explanation and a recommended management action.
I think that the top-five discipline is the point. A full variance report with two hundred lines gets skimmed. Five ranked exceptions, each with a reason and an action, get read and acted on, and the rest of the P&L is still there in the appendix for anyone who wants it.
Its first rule is to check that a budget exists before doing anything. If the budget table has no rows for the year, it runs the same analysis against prior-year actuals, retitles the report, and says prominently that there's no budget. It never fabricates a budget line, which is a failure mode I've seen in less careful prompts.
Why It Moved: Variance Root Cause
Where the budget variance prompt identifies and ranks, the Variance Root Cause Analysis takes the top three variance cost centers or accounts and answers why. How much of each variance is rate, how much is volume or activity, how much is vendor price changes, headcount shifts, one-time items, or timing, with each attribution supported by transaction-level evidence.
The rule that keeps it honest is that the attribution has to sum. Rate, volume, mix, one-time, timing, and residual have to reconcile to the total variance. Anything unexplained is reported as unattributed, with its dollar size, and never silently absorbed into another driver. A driver is claimed only when the transactions support it.
What's Next: Three Scenarios
The Three-Scenario Financial Forecast builds base, optimistic, and pessimistic twelve-month paths for revenue, gross margin, operating income, and ending cash. The base case is anchored in system data: open sales orders, open estimates weighted by probability where the account maintains it, and trailing run-rates with seasonality. The scenario deltas are assumptions layered on top, and every macro assumption, from demand growth to input-cost inflation to wage inflation to interest rates, is a labeled input with a sensible default that you can override. Nothing about the future is hidden inside the model.
What's Next for Cash: A Rolling Twelve Months
The Rolling 12-Month Cash Flow Forecast is the long-horizon companion to a 13-week cash model. Where the 13-week model schedules known transactions, this one blends the known near-term items, open receivables, open payables, and backlog, with run-rate projections for collections, disbursements, and recurring obligations, and reports expected inflows by month, projected cash requirements, and liquidity coverage.
Starting cash has to come from the live bank-balance query, never from an estimate unless there's no live balance to read. Every figure traces to a query, a disclosed trailing average, or a labeled user input.
What's Next for Headcount
The Workforce Expansion Impact Assessment models what adding headcount to a named department does to next year's budget and profitability. Its credibility comes from one design choice. The loaded-cost multiplier is derived from live P&L actuals, payroll taxes, benefits, insurance, and leave accounts divided by salaries and wages over the trailing twelve months, rather than from the "1.3 times salary" folklore that most models start with. The report shows the accounts and the ratio. Productivity gains are user assumptions, and they're labeled as such.
The Chain
What I like about these six together is that each one hands off to the next. The flux tells you what moved. The variance prompts tell you whether it moved against plan and why. The forecasts take the run-rates and the backlog that the earlier prompts already verified and project them forward, with the assumptions in the open. And every one of them is read-only, with its queries in the appendix, so the numbers can be checked by someone who wasn't in the room.
All six will be in the next release of the Sonar AI Prompt Library. The P&L Flux Analysis will be free, and the other five will be in the paid tier. I'll post here when it's out.