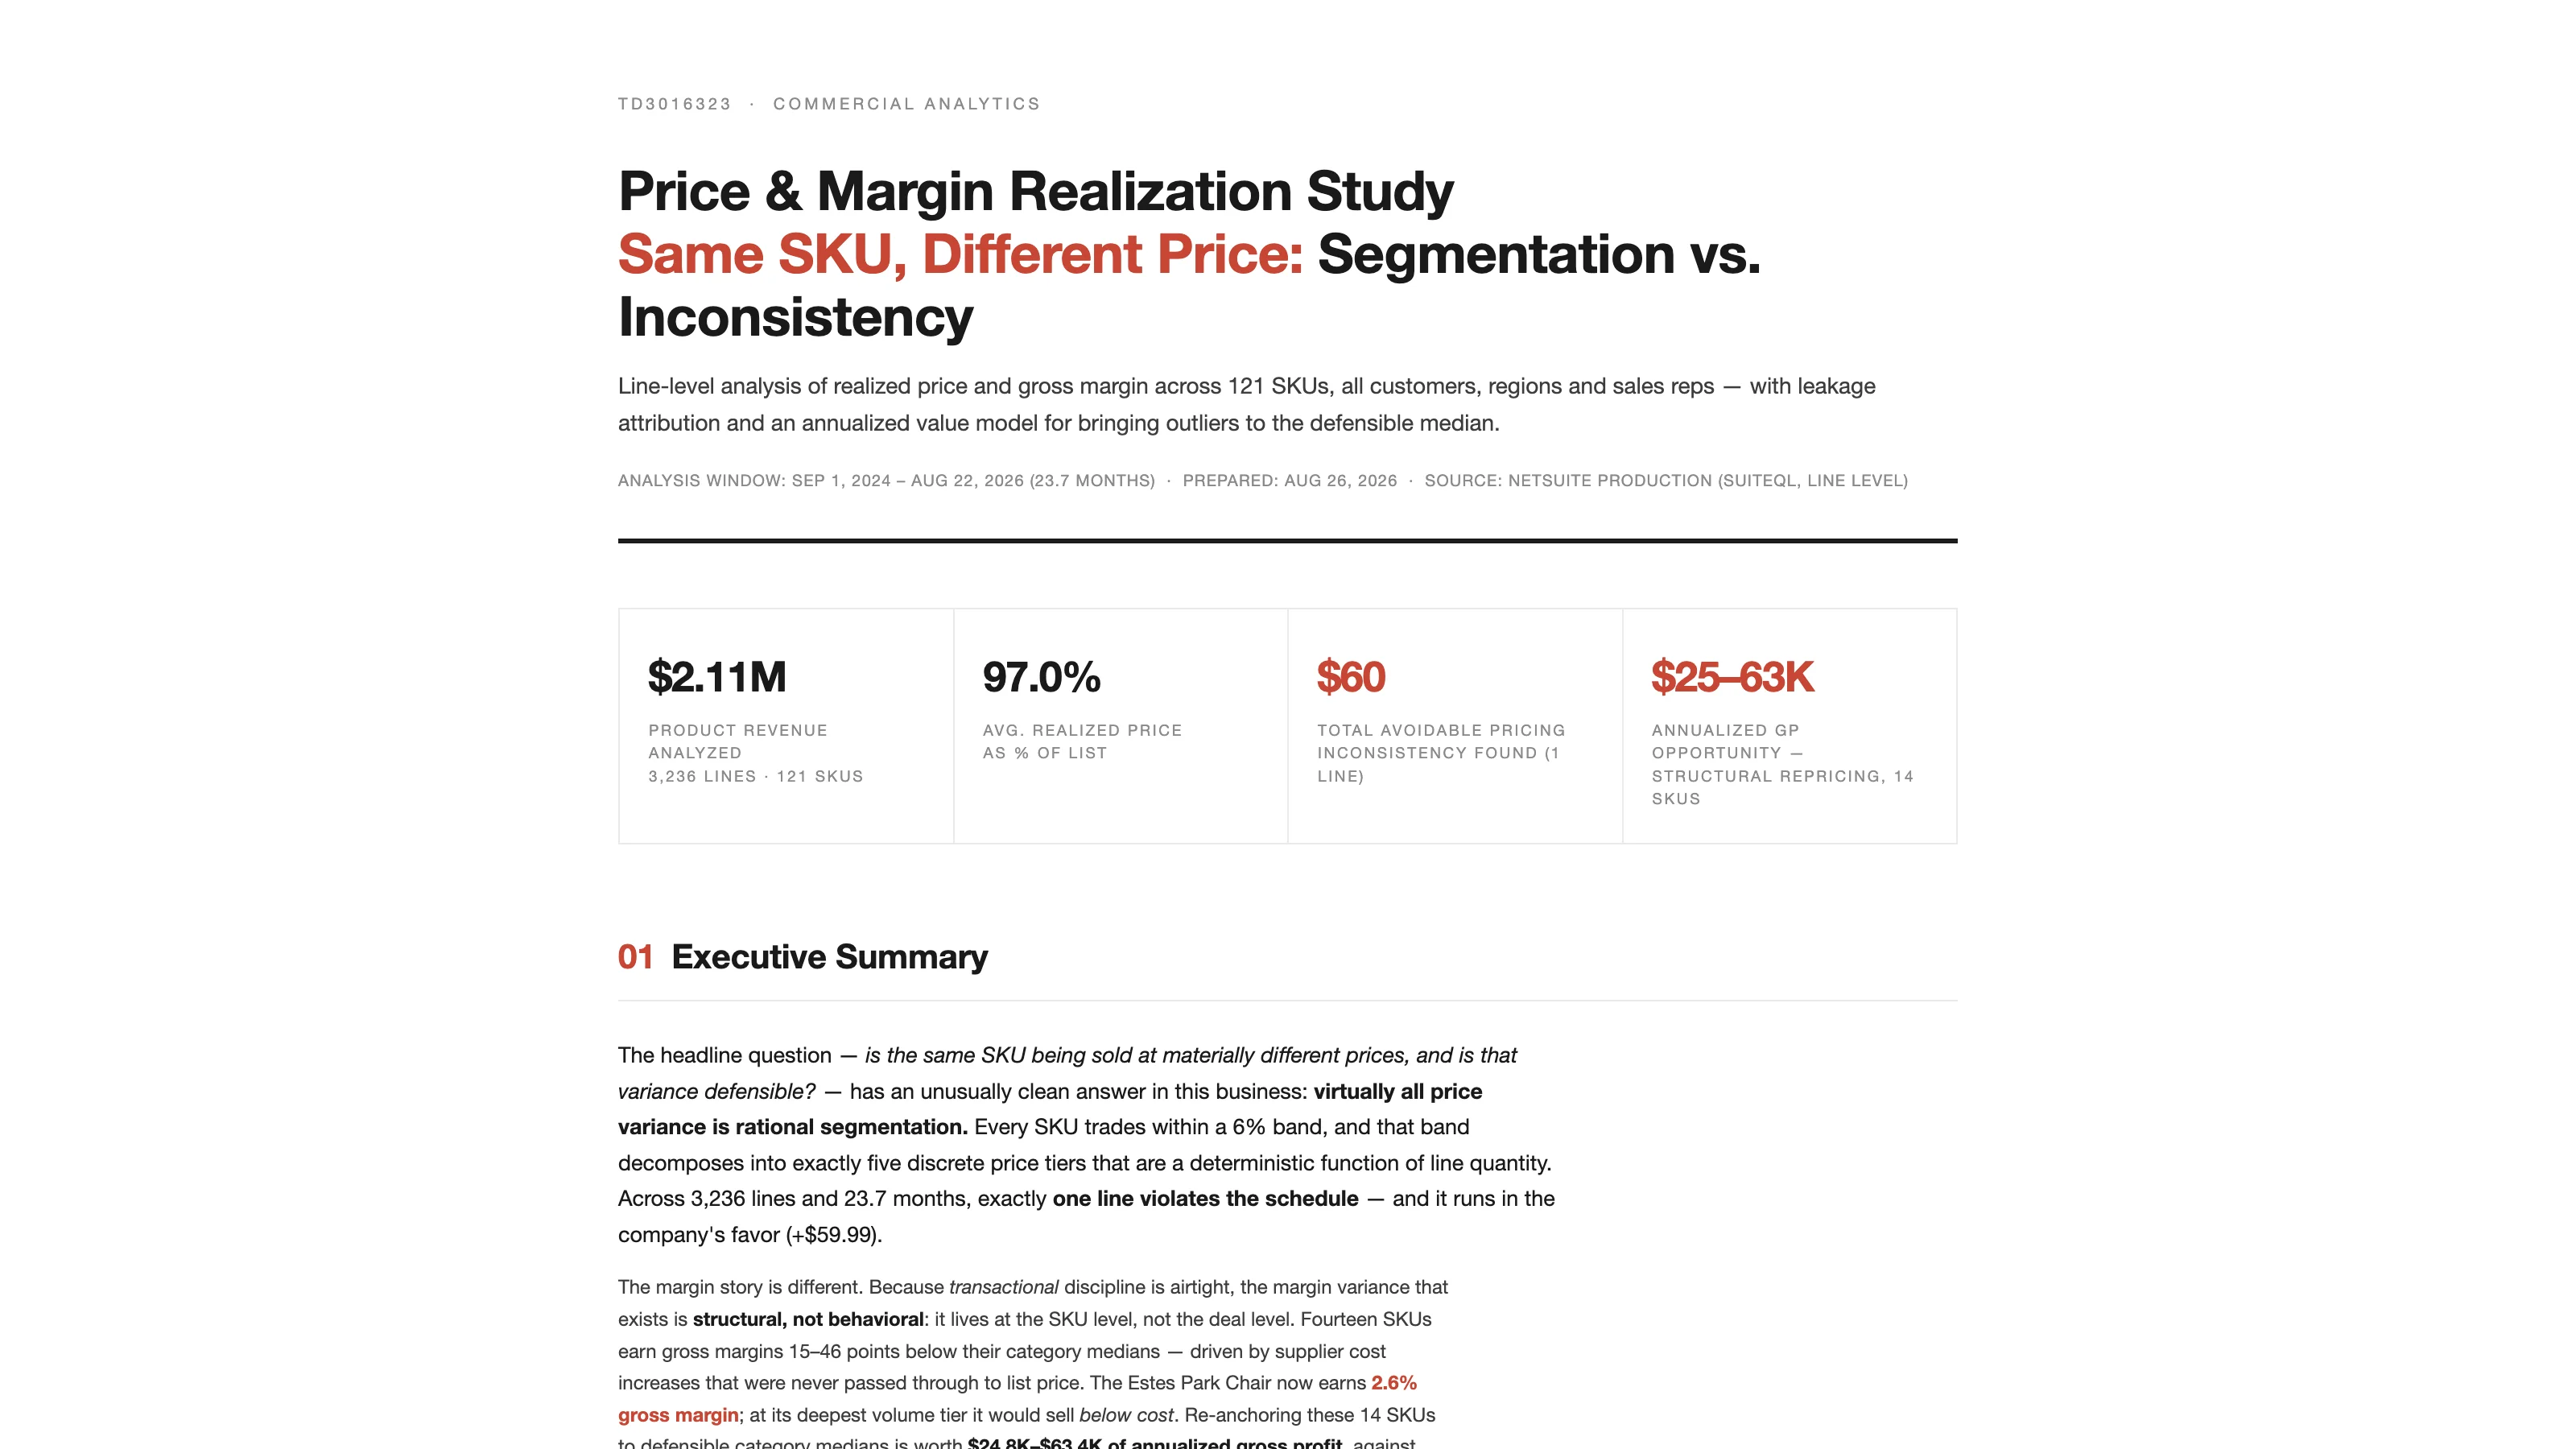
In 23.7 months and 3,236 product lines, exactly one line on my NetSuite test account sold at a price the schedule didn't call for. The customer was overcharged $59.99.
That's the transactional leakage finding from the Price and Margin Realization Study, and it's a good result for the business. It's also why the report spends most of its length somewhere else. Pricing discipline on this account is airtight, so the margin problem that exists lives in the price file, where supplier costs rose and list prices never followed. It went into the Sonar AI Prompt Library in September. If you're new to this, Sonar AI is an AI agent that runs inside NetSuite. Every prompt in the library is a playbook that I engineered and tested against live NetSuite data, and you run it inside your own account, against your own records. Nothing leaves the account, and nothing is written to it.
Five Tiers, No Scatter
The prompt expresses every product line on every invoice and cash sale as a ratio of its unit price to the SKU's list price, where list price is the maximum observed sold price for that SKU. On the test account, the entire dataset collapses onto five discrete points with nothing between them: 100% of list for one to four units, then 97%, 96%, 95%, and 94% at quantity breaks of five, ten, fifteen, and twenty. The maximum discount anywhere is 6%. The report validates the list-price anchor against that lattice, since every observed price sits at exactly one of the five ratios.
Then it tests for favoritism three ways and finds none. Stores transact at list on every one of their 1,592 lines, and the distribution centers show 94% to 97% realization because they take wholesale quantities that earn breaks, so what looks like regional pricing is channel mix, and geography adds zero explanatory power once quantity is known. The three sales reps land within a quarter of a point of each other on realized price, and the spread is order-size mix. Across the top twelve customers, realization runs from 94.8% to 97.9%, and every position in that range is explained by average order quantity. No negotiated or contract pricing exists anywhere in the book.
The one violation is an invoice for twenty hoodies at list, where the quantity earned the 94% tier. It's also the only product line in the dataset with no location, which tells you it was keyed manually and bypassed the pricing engine. Immaterial in dollars, and the report calls it material as a control observation, because manual entry is the one door that gets around the schedule, and the door swings both ways.
The Drift Is in Cost
The below-band test, which compares each line's margin to its SKU's median line margin, returns zero rows at either a five-point or a ten-point threshold. There are no fire-sale deals and no quiet exceptions. Realized price as a percentage of list has stayed between 96.4% and 97.9% every month for two years with no trend, so discounting isn't deepening either.
What has moved is cost. Twenty-three SKUs show unit-cost variation of more than 5% within the window. Where cost rose and the list price didn't follow, margin compressed silently, and that is the margin-drift mechanism in this business.
Fourteen SKUs Below Their Category
With transactional leakage ruled out, the report shifts its benchmark from the SKU's own median to the category median across 121 SKUs: 46.2% for apparel, 51.9% for beauty, 48.6% for home and decor. Fourteen SKUs sit fifteen or more points below their category median.
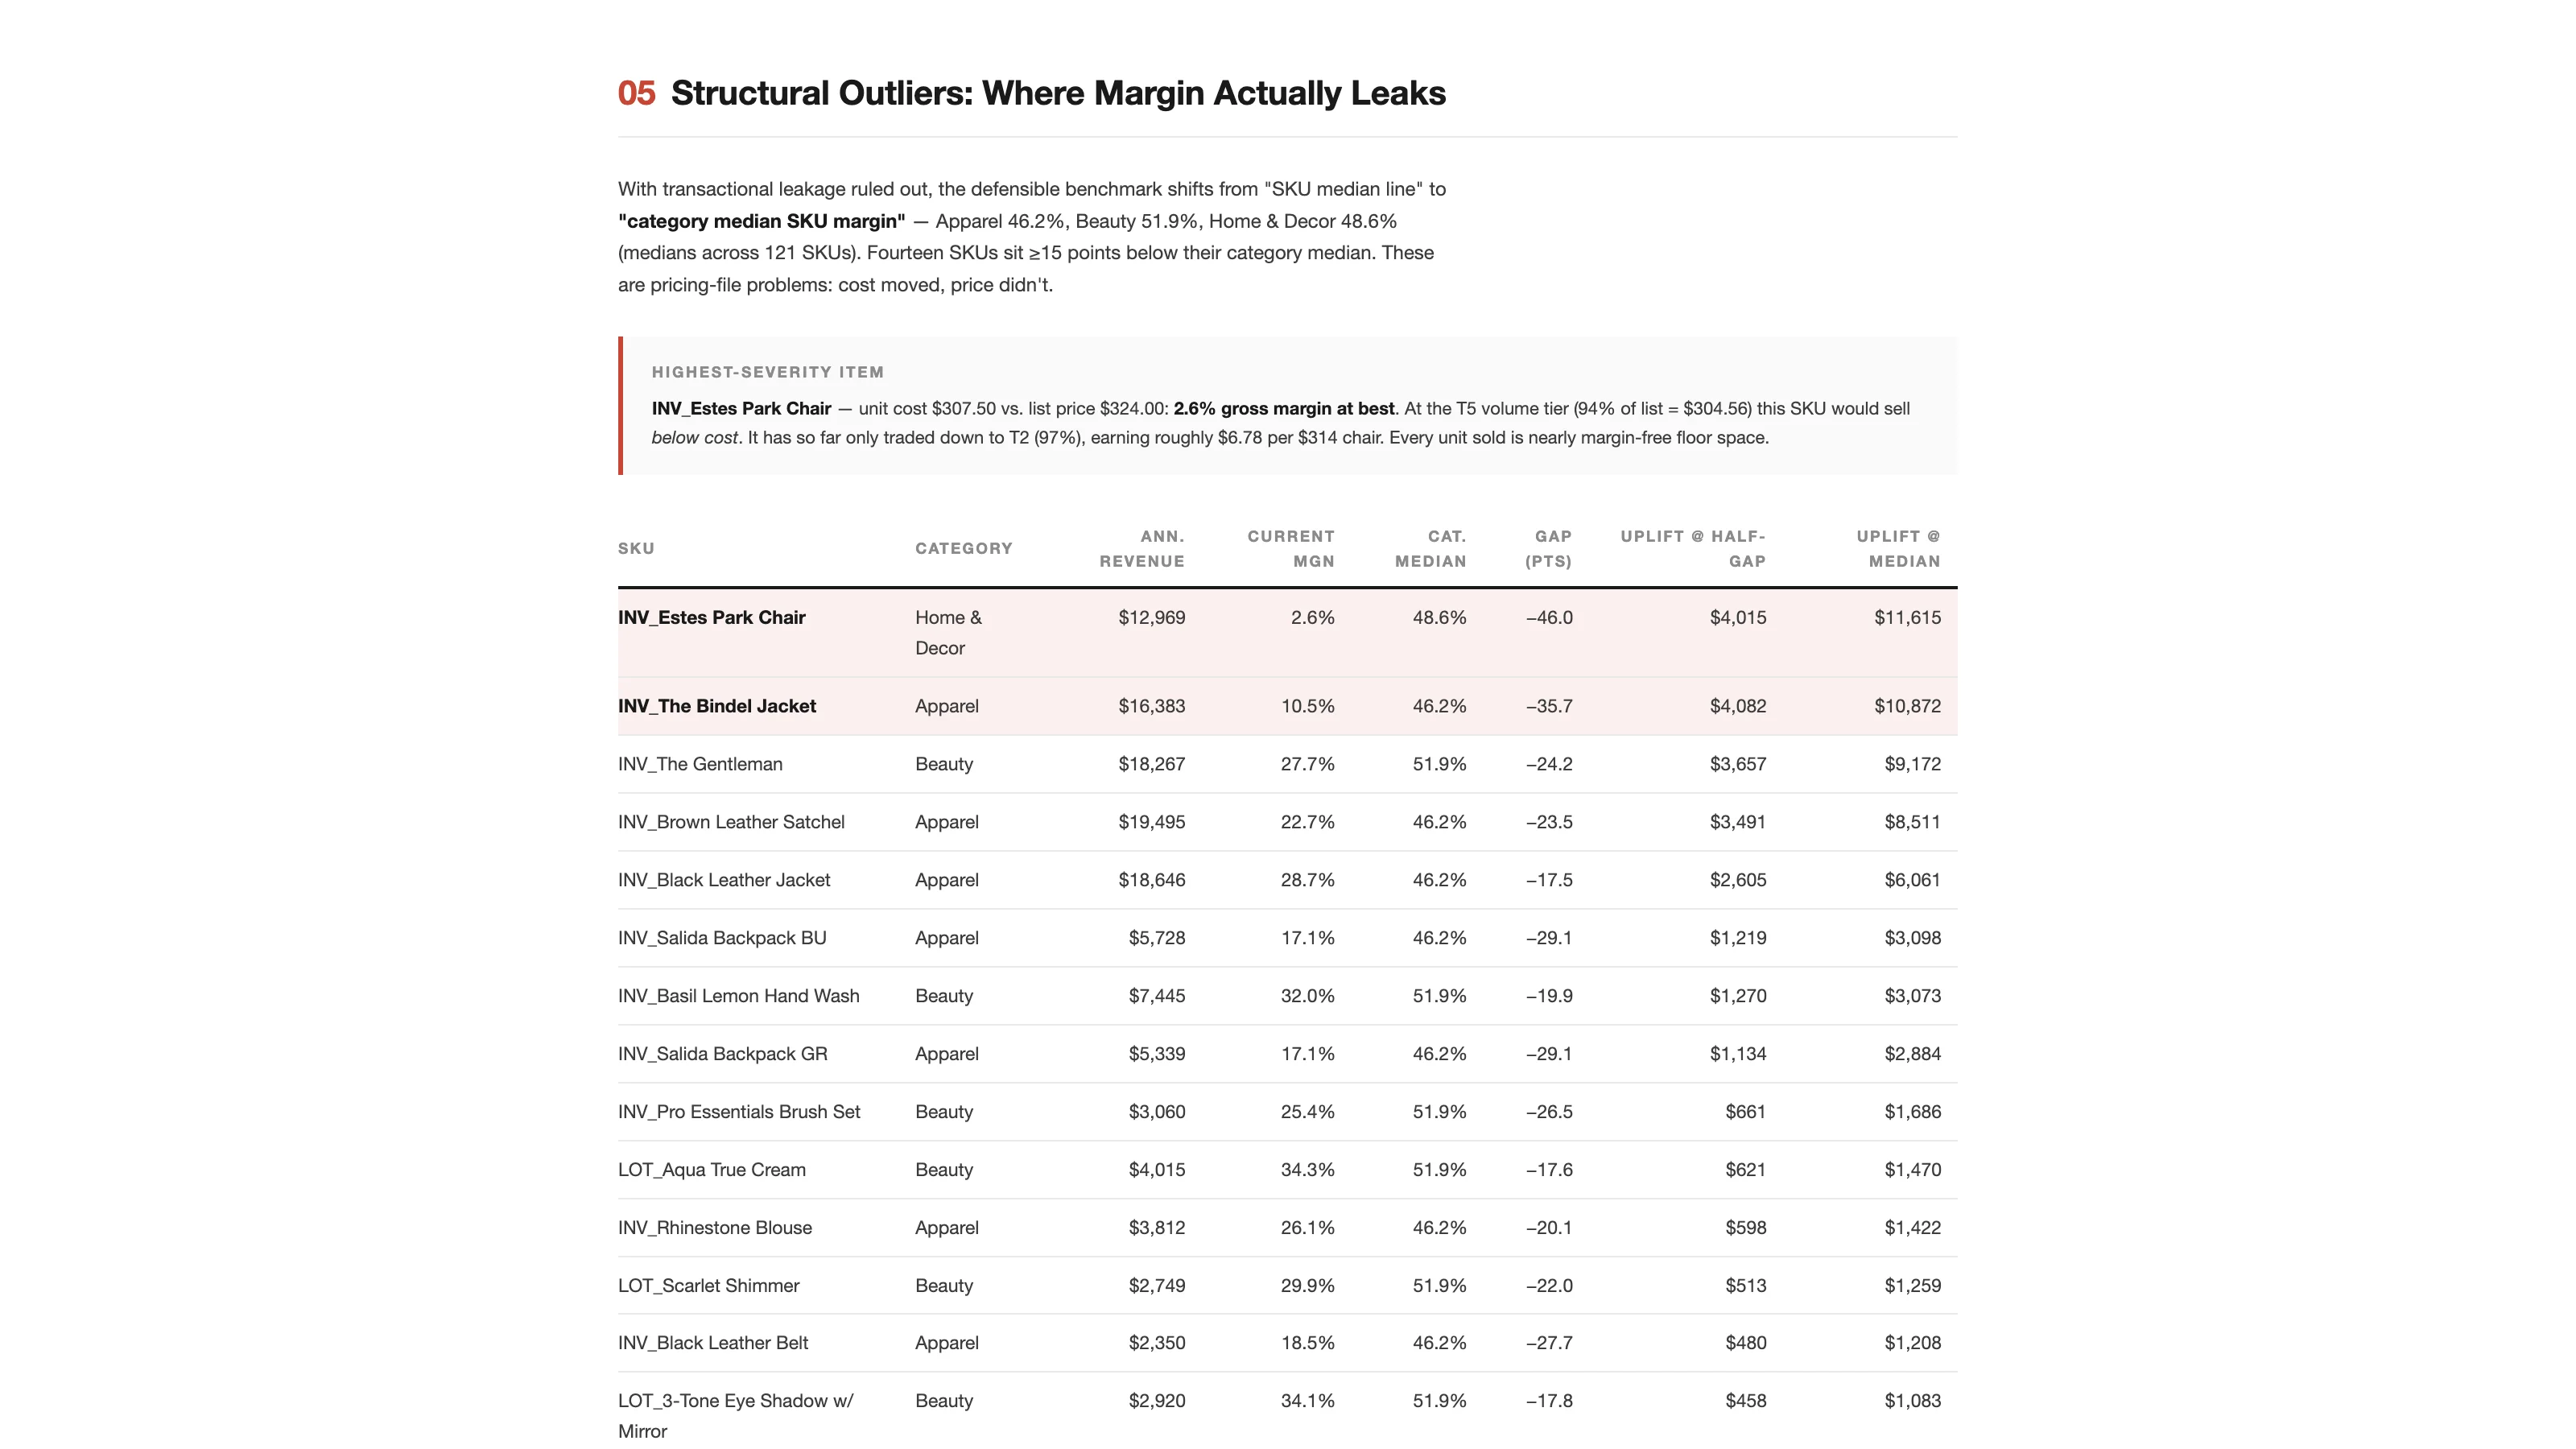
The worst is the Estes Park Chair. Unit cost is $307.50 against a list price of $324.00, which is a 2.6% gross margin at best. At the deepest volume tier it would sell below cost. So far it has only traded down to the second tier, earning about $6.78 on a $314 chair. The Bindel Jacket earns 10.5%. Those two carry 35% of the total opportunity and are the two where cost inflation demonstrably outran a frozen price.
The report sizes the opportunity two ways and is careful about which one to believe. Closing half the gap to the category median, with price increases of 14% to 31%, is worth $24,804 of annualized gross profit across the fourteen SKUs, and it calls that the conservative, demand-aware case. Closing the full gap requires increases up to 90% and is worth $63,414, which it calls a theoretical ceiling that's almost certainly demand-destructive for the worst items.
What It Recommends
Reprice the two red SKUs immediately, and if the market won't bear the price, then discontinue rather than continue selling at cost. Institute a cost-passthrough trigger, so any SKU whose unit cost moves more than 5% flags for repricing, using the detector query in the appendix. Close the manual-entry door. Populate purchase costs on 23 electronics accessory lines that carry no cost estimate and report 100% margin, invisible to any control. Protect the tier schedule, which the report describes as an asset, and benchmark any future move to negotiated pricing against it.
And one recommendation about what to leave alone: don't chase rep-level pricing controls. The data shows zero rep discretion in pricing, and controls aimed at rep discounting would address a problem this business doesn't have.
How It's Built
Seven SuiteQL queries in the appendix. Two of them are meant to be re-run as standing detectors: the schedule-violation query, which currently returns one row, and the cost-variation query, which feeds the passthrough trigger. Margin uses the line-level cost estimate, and the report says that can differ from posted cost of goods under actual or average costing. The repricing scenarios assume static volume and cost, and the half-gap case exists precisely to hedge that. Elasticity is explicitly unmodeled here, which is what the companion study is for.
Wrapping Up
Everyone assumes pricing leaks at the deal level. On this account it leaked upstream, in a price file that hadn't been touched while supplier costs moved. Before tightening discount approvals, it's worth checking whether your list prices still reflect your costs.
Price and Margin Realization Study is in the paid tier of the library. The full sample report from the test account is online, and I covered the whole September release in a separate post.
A five-tier schedule applied with 99.97% fidelity for two years is rare discipline. The chair that earns $6.78 is what happens when the discipline is on the wrong side of the price.