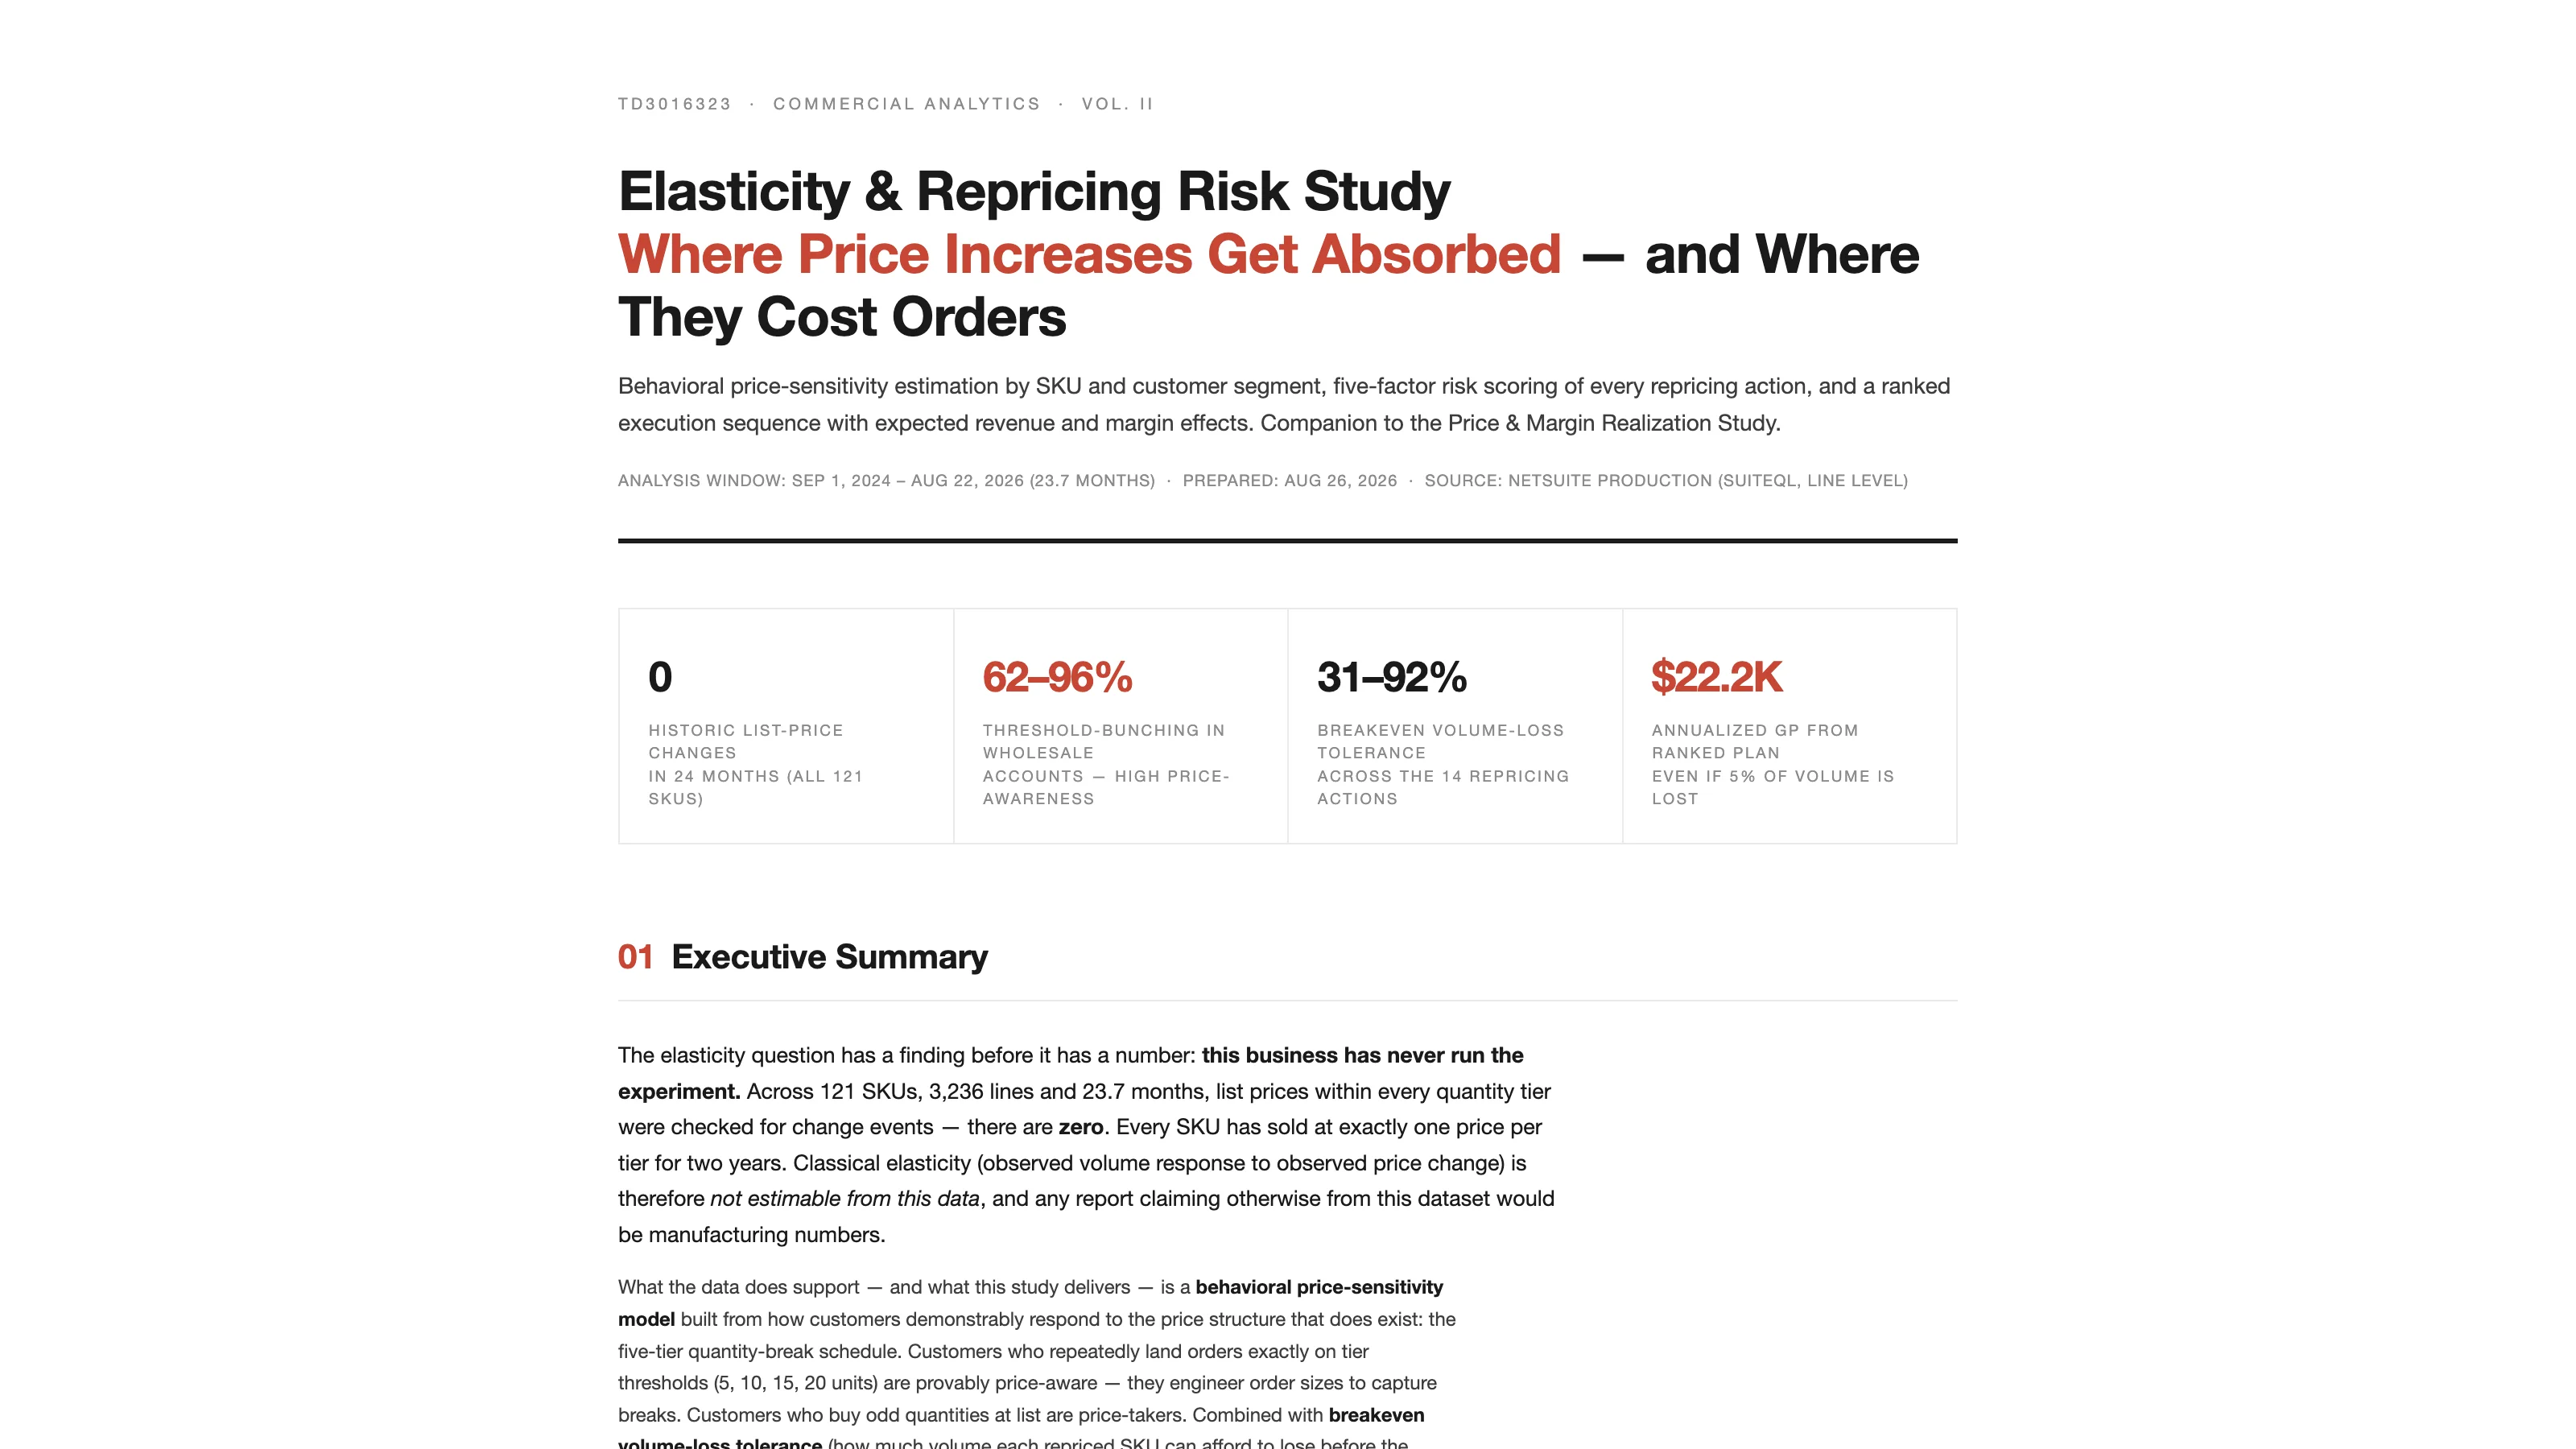
My NetSuite test account has never changed a price. Not one list price on any of 121 SKUs moved in 24 months. So when I asked the Elasticity and Repricing Risk Analyzer which price increases customers would absorb and which would cost orders, the first thing it did was refuse to estimate elasticity.
Its words: classical elasticity is not estimable from this data, and any report claiming otherwise from this dataset would be manufacturing numbers. I built the prompt with that rule in it, and I was glad to see it hold. It went into the Sonar AI Prompt Library in September as the companion to the Price and Margin Realization Study. If you're new to this, Sonar AI is an AI agent that runs inside NetSuite. Every prompt in the library is a playbook that I engineered and tested against live NetSuite data, and you run it inside your own account, against your own records. Nothing leaves the account, and nothing is written to it.
Proving the Experiment Was Never Run
The test is simple. For every SKU and quantity-tier cell, count the distinct realized unit prices. If list prices ever moved, then cells would show two or more prices with a date boundary between them. About 480 cells were tested. Zero showed a change. The monthly realized price as a percentage of list had no trend breaks in 24 months, and there were zero discount or markup line items, so there was no promotional variation either. The only price variation in two years is the quantity-tier schedule itself, and that's simultaneous with quantity choice, so it identifies willingness to bunch rather than demand elasticity.
The report frames the absence as the finding. Two years of frozen prices through a period when supplier costs rose up to 100% means the business has been running a one-sided experiment: cost discovery without price discovery.
Three Honest Instruments
What the data does support is a behavioral model built from how customers respond to the price structure that exists.
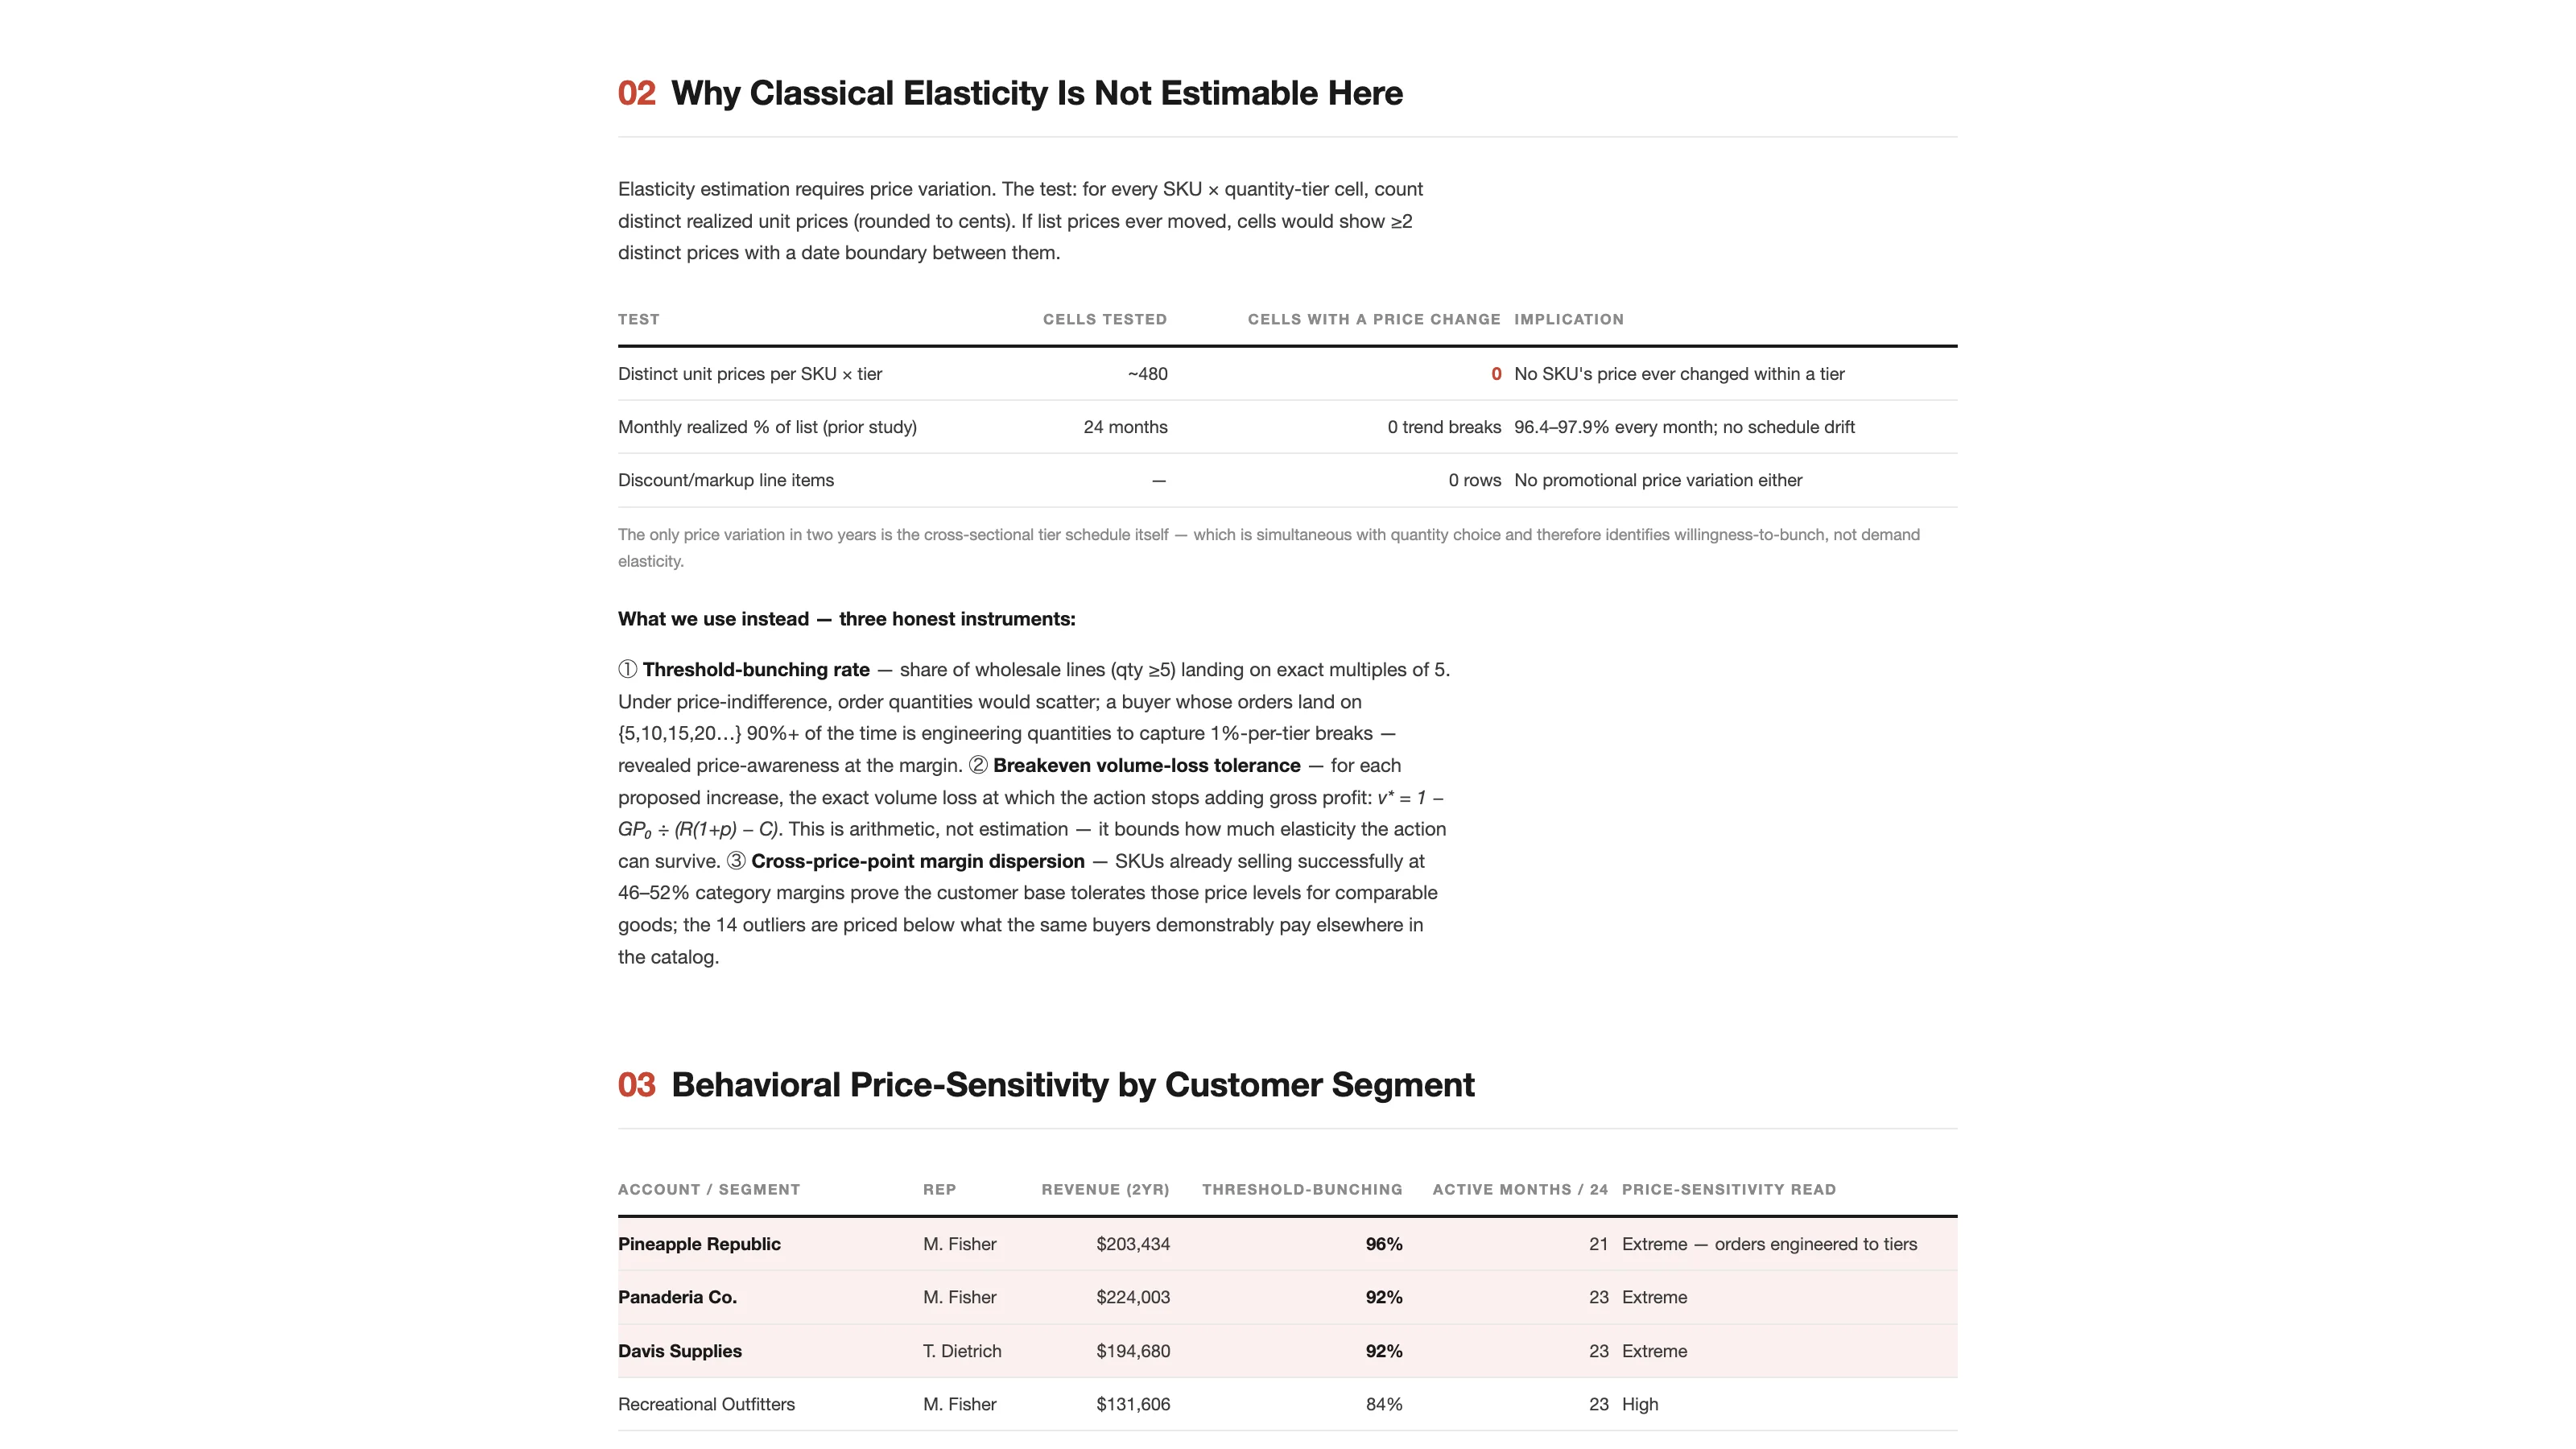
The first instrument is threshold bunching: the share of wholesale lines that land on exact multiples of five units, which are the tier thresholds. Under price indifference, order quantities would scatter, and random ordering would produce about 20% bunching. A buyer whose orders land on the thresholds 90% of the time is engineering quantities to capture 1%-per-tier breaks, and that is revealed price-awareness. Pineapple Republic bunches at 96%, Panaderia at 92%, Davis Supplies at 92%. Every managed wholesale account is between 62% and 96%. The 66 retail walk-in customers are at roughly zero: they buy one to four units at list and are the classic price-takers.
The second is breakeven volume-loss tolerance. For each proposed increase, the report computes the exact volume loss at which the action stops adding gross profit. The formula is on the page, and it's arithmetic rather than estimation. The Estes Park Chair, earning 2.6% today, can take a 31% price increase and lose 92% of its volume before the increase stops paying. When margin is that thin, almost any price is better than the current one, even if most buyers walk.
The third is cross-price-point margin dispersion. SKUs already selling successfully at 46% to 52% category margins prove that the customer base tolerates those price levels for comparable goods. The fourteen outliers are priced below what the same buyers demonstrably pay elsewhere in the catalog.
There's a paragraph headed "interpretation discipline" that I'd point to as the reason this report is trustworthy. Bunching proves that buyers respond to structure. It does not prove that they'll defect at a higher level with the tiers intact. So high bunching raises the risk score and the monitoring requirement without being treated as a prediction of loss.
Scoring the Risk
Each of the fourteen repricing actions carried over from the companion study is scored from 0 to 100, twenty points per factor, with every factor computed from account data and its formula shown: buying consistency, purchase frequency, customer dependency, margin headroom, and the elasticity proxy. The report notes what the scoring surfaces. The Estes Park Chair, the biggest margin problem, also carries the highest behavioral-elasticity proxy and 55% single-customer dependency. Its economics justify action, but silently, through the price file, it's the wrong move. With a rep conversation, it's the right one.
The Plan, Under Three Demand Responses
The ranked plan yields $24.8K of annualized gross profit if no volume is lost, $22.2K at a 5% loss, and $19.7K at a 10% loss. Every action is shown under all three. Wave 1 is the three lowest-risk SKUs with broad customer bases, executed as silent price-file updates for retail and a 30-day advance note to wholesale, with a 90-day checkpoint measuring repeat-order rate and average quantity per account. Wave 2 follows at day 60 and includes the chair, with the rep conversation first. Wave 3 at day 120 takes the seven small SKUs, one of which sits there despite ranking seventh because it has 62% single-account dependency and 97% bunching, so it must follow the two customer reviews rather than lead them.
The instructions around execution are specific. Raise list and leave the tier ladder intact, because the bunching data shows wholesale buyers are attached to the structure, and preserving it makes a level change legible rather than arbitrary. Don't reprice through rep discretion, since the companion study proved that pricing discipline is this account's strength. And instrument everything, because Wave 1 doubles as the price experiment the account has never run, and after six months the observed volumes replace the proxies in this report.
Limits
The model can't be validated in-sample, because there are no historic price events to validate against. It's falsifiable only by running Wave 1, and the report says that's by design. Cost is held constant. Volume-loss scenarios are applied uniformly per SKU, and concentrated defection is handled by sequencing rather than by the math. The six SuiteQL queries are in the appendix, including the monthly monitoring query meant to run after each wave, and the scenario and risk computation is printed as JavaScript.
Wrapping Up
Elasticity and Repricing Risk Analyzer is in the paid tier of the library. The full sample report from the test account is online, and I covered the whole September release in a separate post.
An honest "we don't know yet" beats a confident guess. This report says it, shows what it knows instead, and turns the first price change into the measurement.