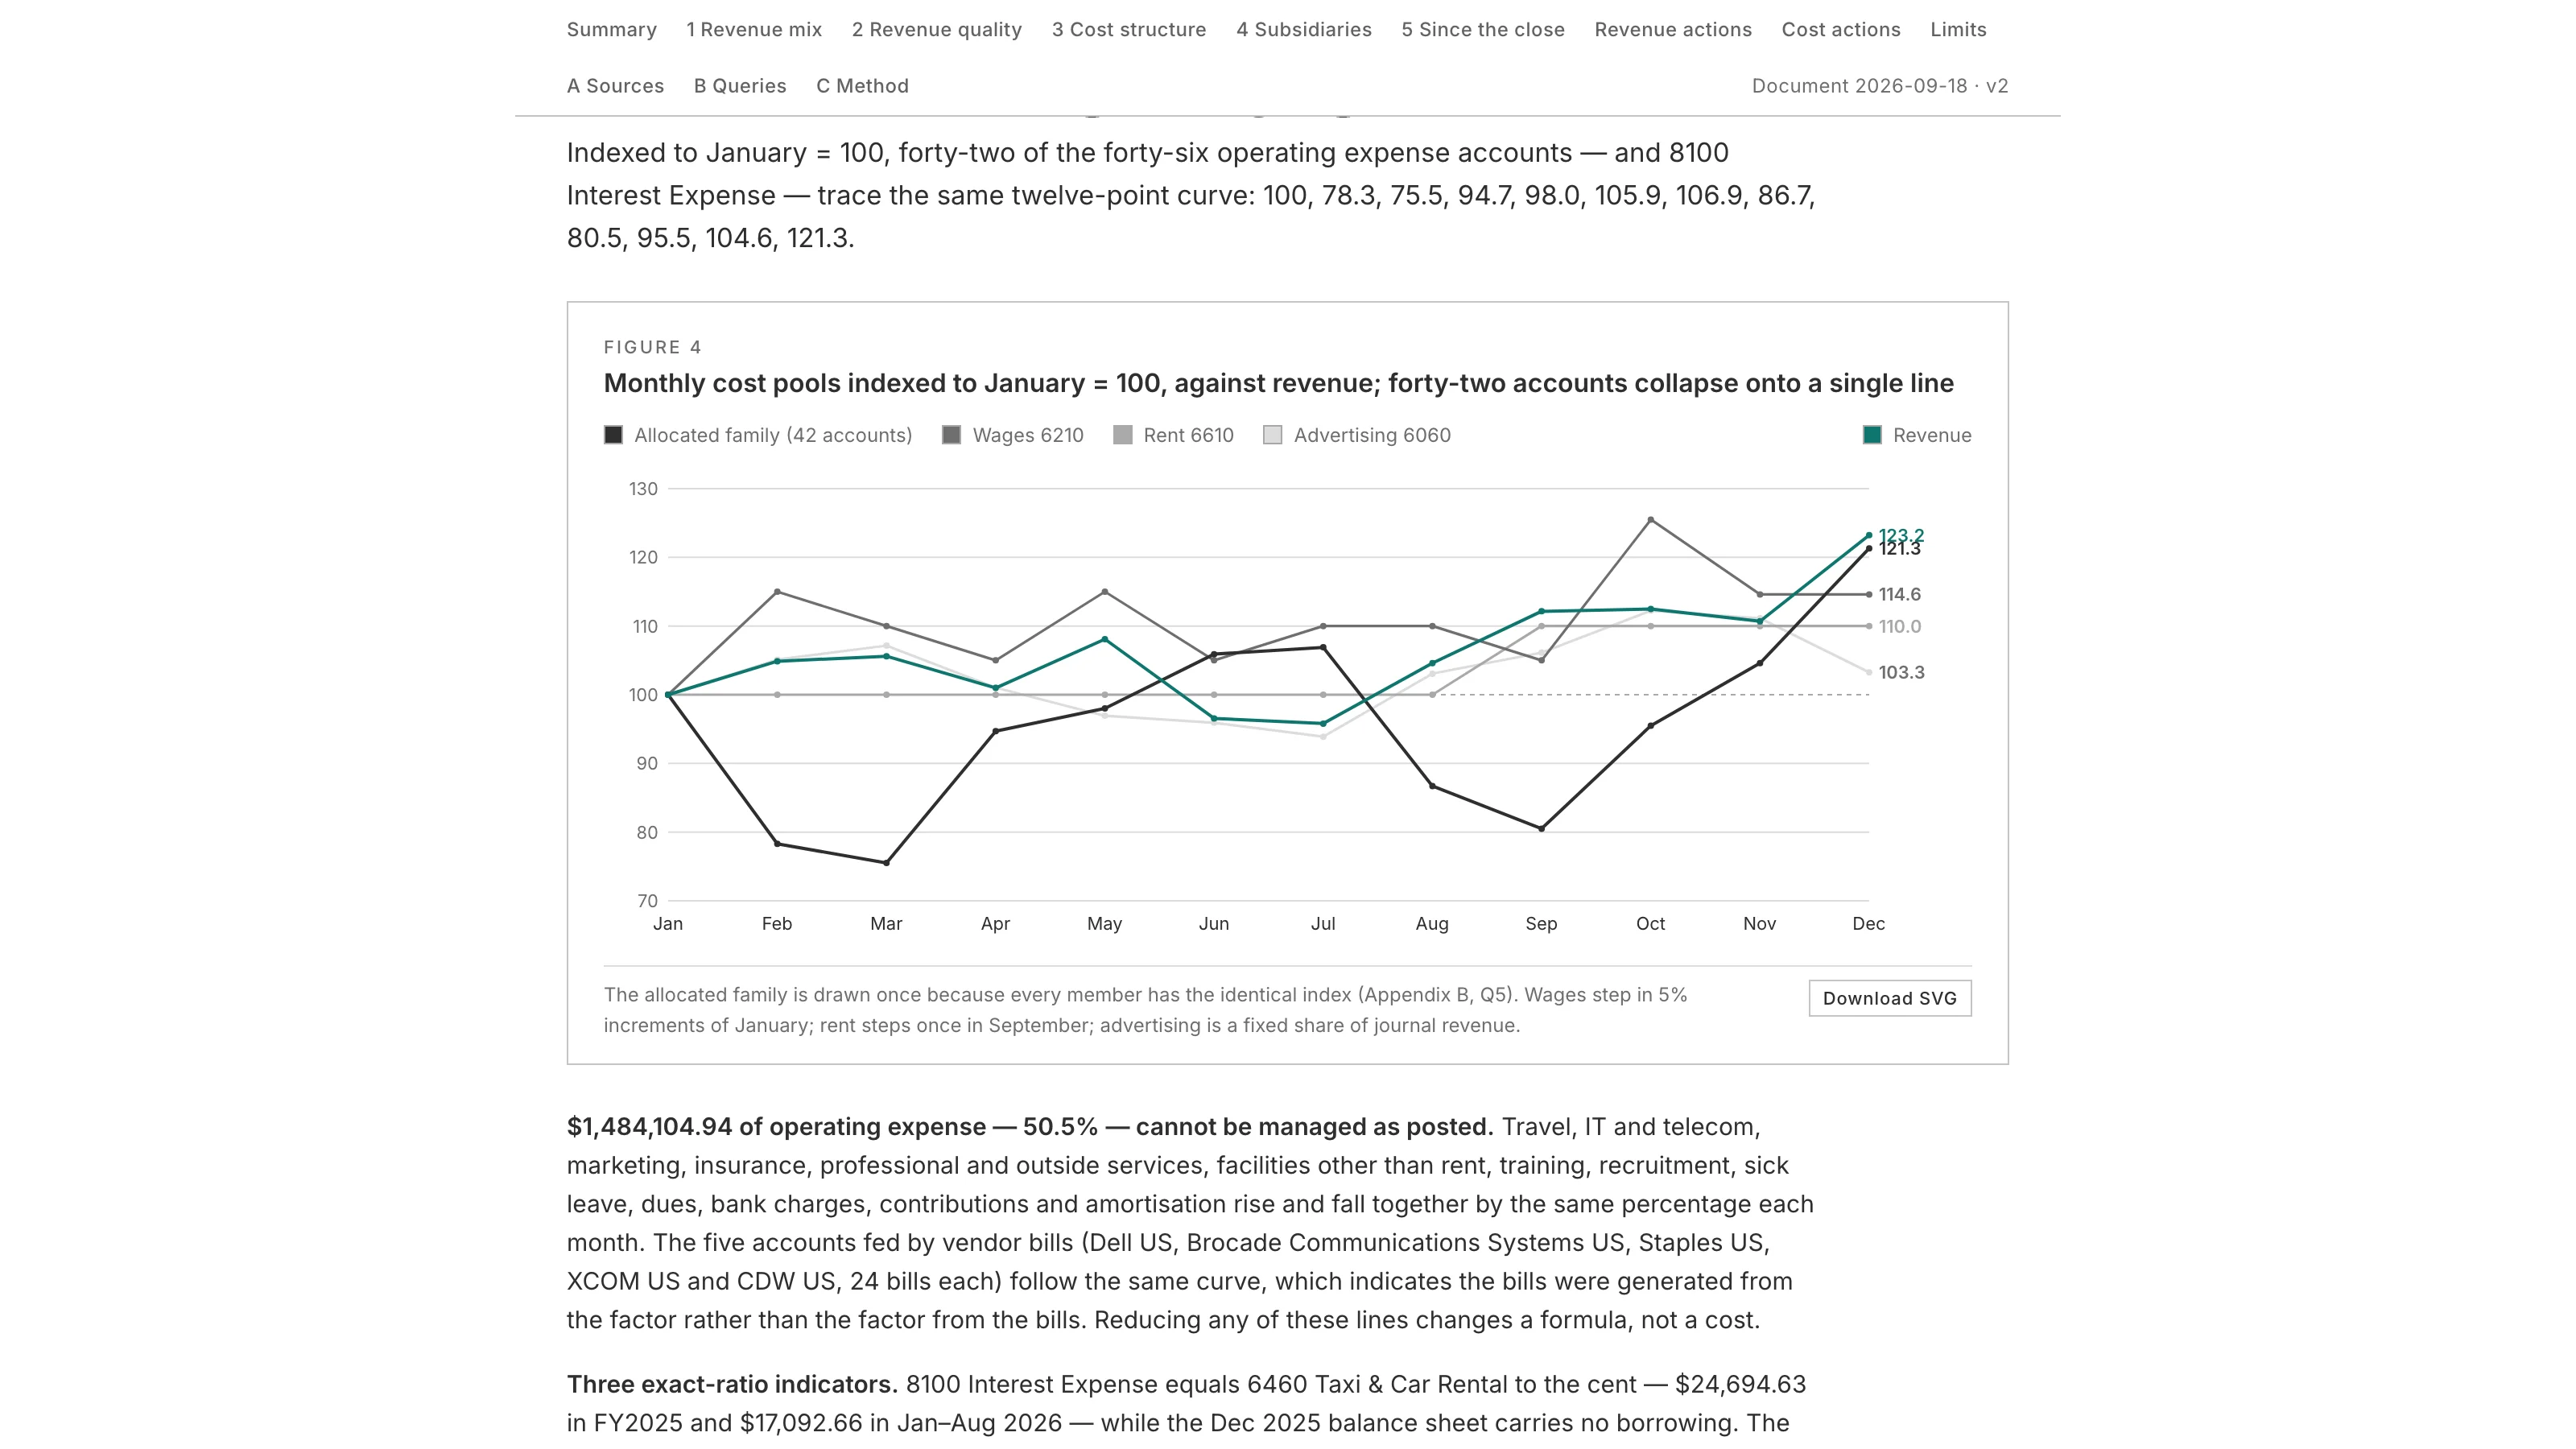
Forty-two of the forty-six operating expense accounts on my NetSuite test account rise and fall by the same percentage every month. So does interest expense. Indexed to January, every one of them traces the same twelve-point curve, to one decimal place, for the entire fiscal year.
That means half of operating expense, $1,484,104.94 of it, is an allocation. Travel, IT, marketing, insurance, professional services, training, bank charges, and thirty-odd other lines can't be managed as posted, because reducing any of them changes a formula rather than a cost. The five accounts fed by vendor bills follow the same curve too, which tells you the bills were generated from the factor rather than the factor from the bills.
The Income Statement Review prompt found that in Section 3, and it's the reason the report's first cost recommendation is to fix the posting basis before touching any line. Every other cost recommendation is conditional on that one. It went into the Sonar AI Prompt Library in September. If you're new to this, Sonar AI is an AI agent that runs inside NetSuite. Every prompt in the library is a playbook that I engineered and tested against live NetSuite data, and you run it inside your own account, against your own records. Nothing leaves the account, and nothing is written to it.
Starting From the Printed Statement
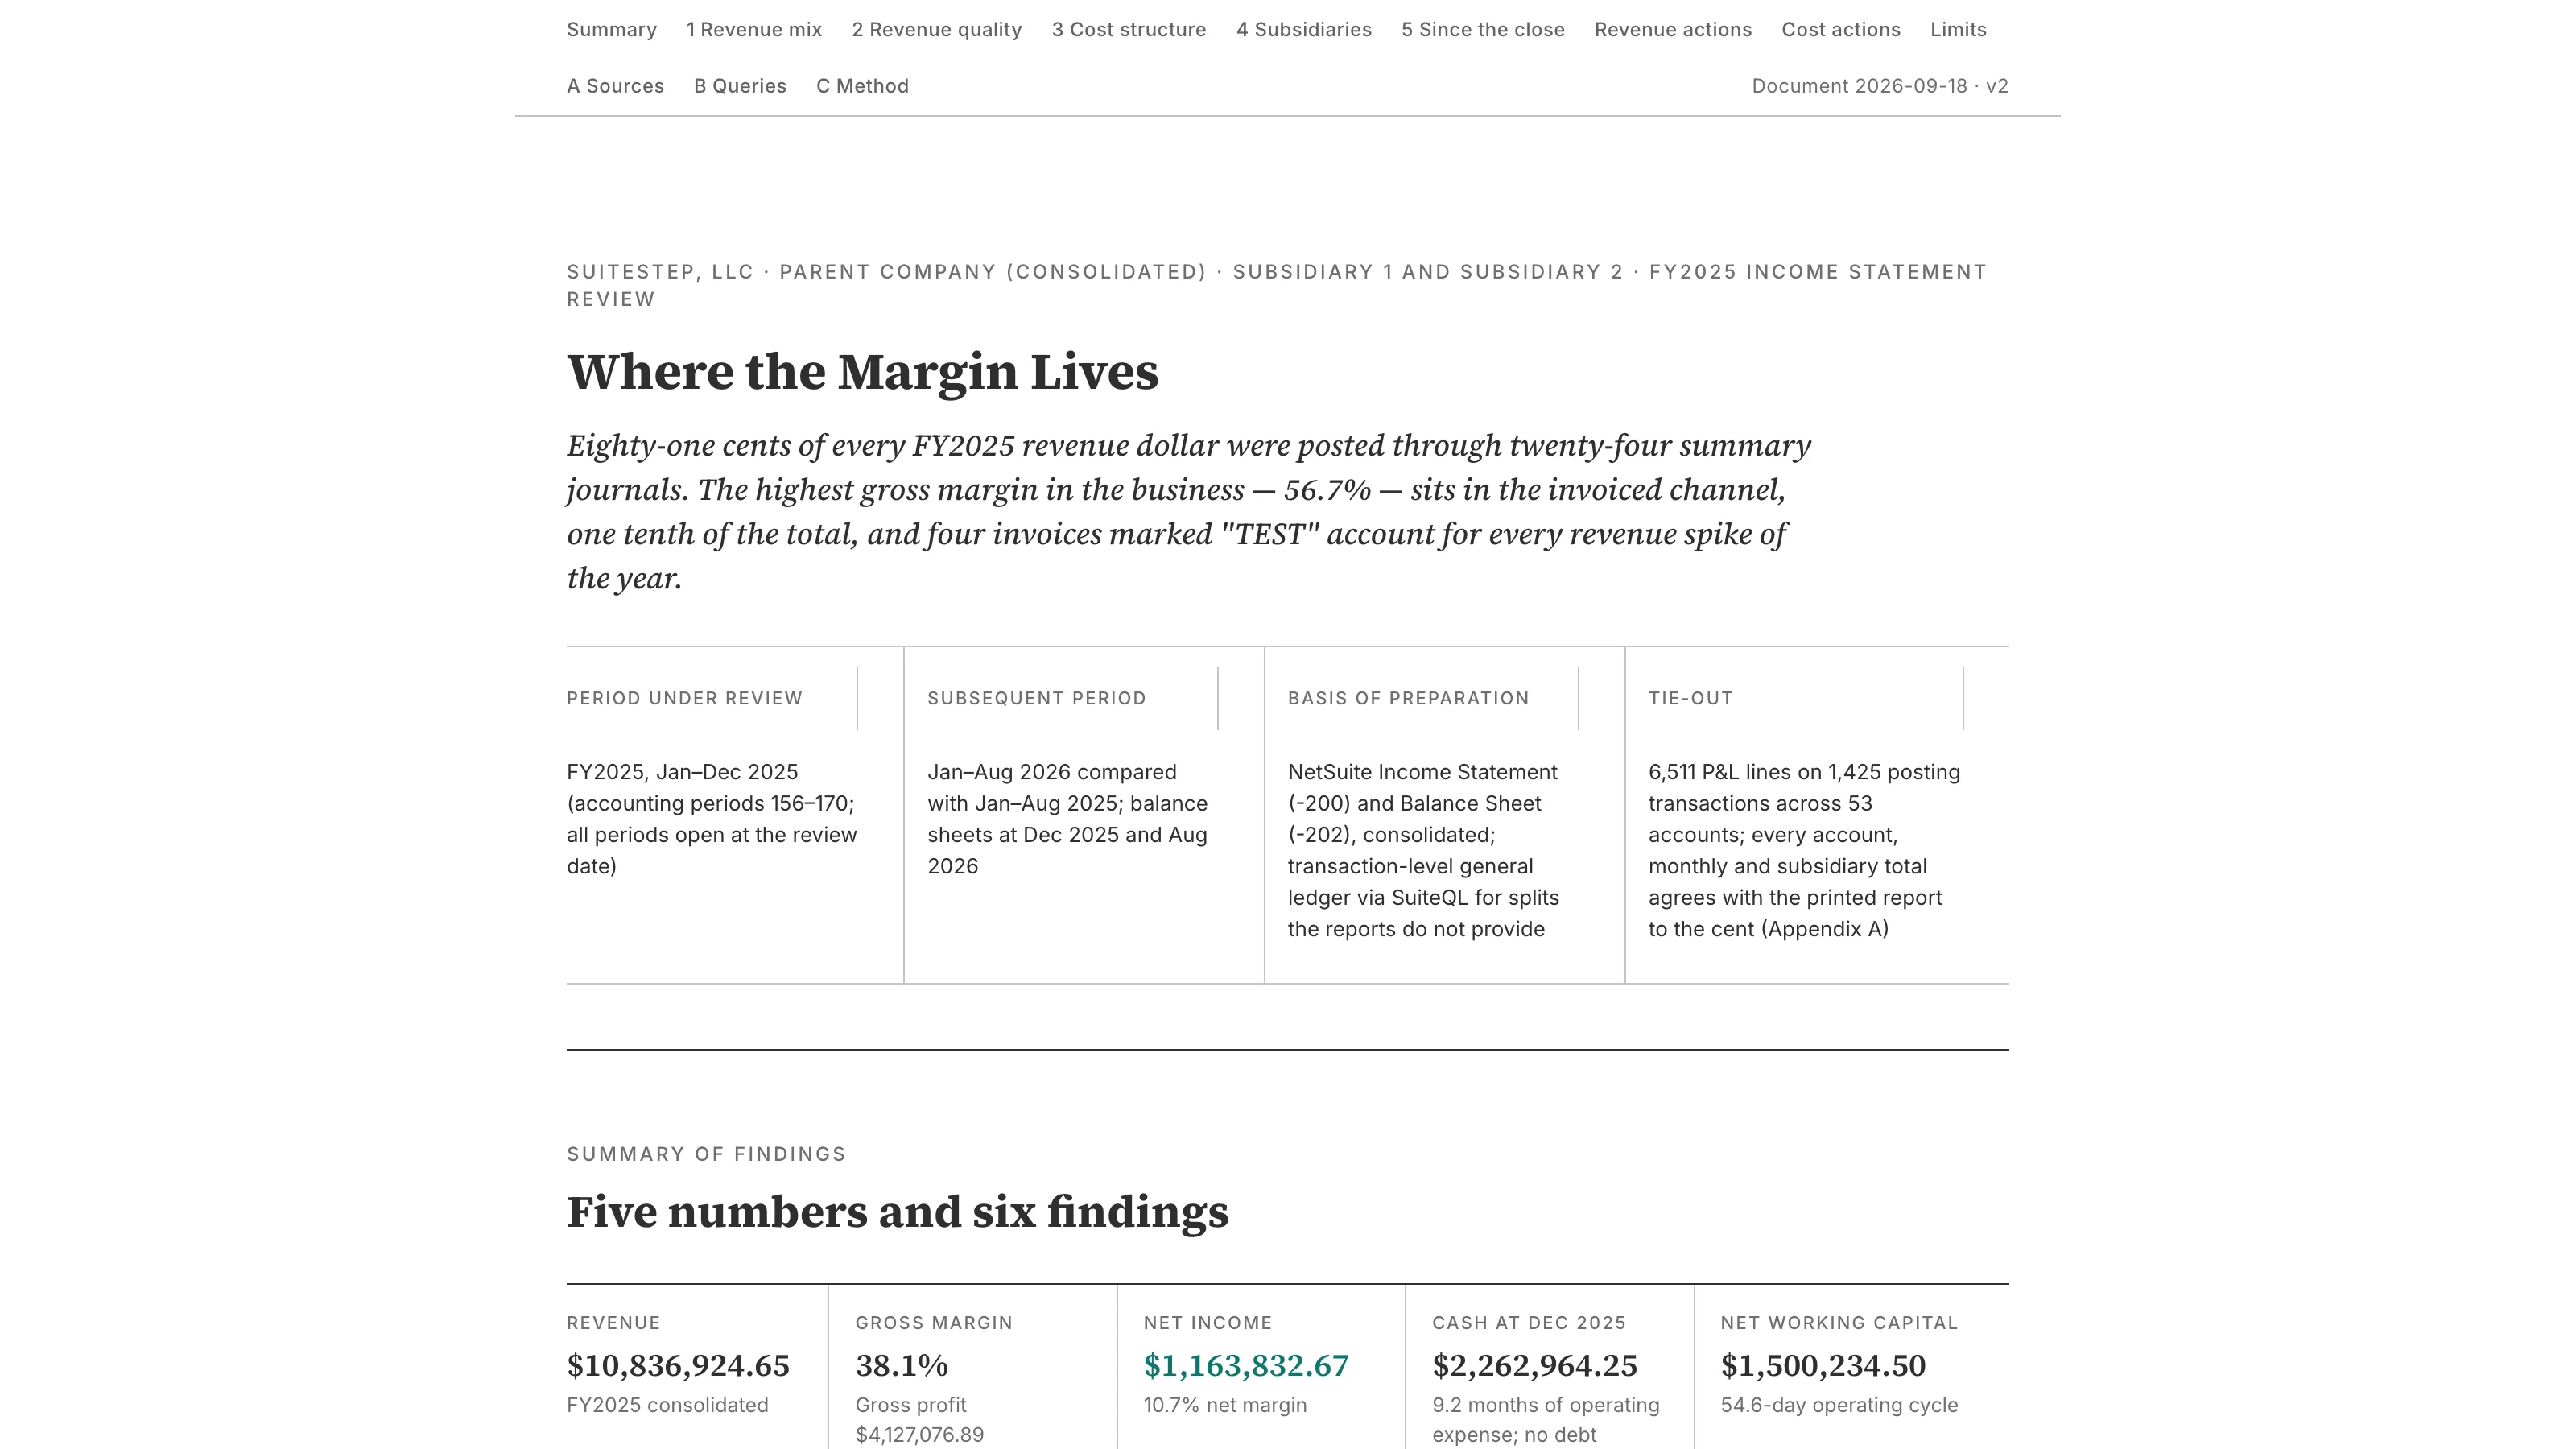
The prompt begins where a controller would: it runs NetSuite's own income statement and balance sheet, by month, in total, and by subsidiary, and it reconciles every account total it derives from the general ledger back to the printed subtotal before it analyzes anything. On the test account that was 6,511 profit-and-loss lines on 1,425 posting transactions across 53 accounts, and every account, monthly, and subsidiary total agreed to the cent. The tie-out table is Appendix A.
Then it goes looking for what the statement doesn't say.
The Largest Channel and the Most Profitable One
The printed statement presents product revenue as a single line of about $10.06 million. Split by posting source instead of by account, that line is four businesses. Summary journals carry $8.82 million, 81.4% of revenue, at a 37.2% gross margin. Invoiced business carries $1.18 million at 56.7%. Services carry $767K at 19.8%. Cash sales carry $72K at 46.6%. The largest channel earns the second-lowest margin, and the highest margin in the business sits in a channel that is one tenth of the total.
The services margin gets its own caveat. The cost account it's paired with runs at a near-fixed 11.1% of purchases every month, so the 19.8% is an allocation output rather than a measurement, and the report says that the real delivery cost should be confirmed before anyone changes a price.
Four Invoices Explain Every Spike
The summary journals form a stable base between $670K and $801K a month. Three months stand apart, and all three are explained by four invoices in the invoiced channel, each with a memo beginning "TEST," two item lines, no fulfillment, no cost of sales, and an open balance. Together they're $281,243 of revenue and $302,717.94 of receivables. Excluding them, the invoiced channel runs between $60K and $85K a month all year, and the apparent margin expansion from the first quarter to the fourth mostly disappears.
The report gives both readings. If the invoices are test data, then FY2025 revenue is $10.56 million and net income is $882,589.67, which means about a quarter of reported profit is unsupported by shipments. If they're genuine, then $302K has been receivable for nine to sixteen months with nothing shipped. Either way, the shipped margin in the invoiced channel is 43.1%, and the first revenue recommendation is to resolve the four invoices before FY2025 is quoted to anyone outside the company.
Underneath the noise, the invoiced business has a shape. Eight corporate accounts ordered in eleven or twelve months of the year and supplied $701,106, which is 59.8% of invoiced product revenue, with no identifiable acquisition cost. The report treats them as the thing to protect and grow.
Three Ratios the Ledger Shouldn't Produce
Beyond the 42-account cluster, the cost section finds three exact ratios that a real business doesn't generate. Interest expense equals the taxi and car rental account to the cent, in both years, while the balance sheet shows no borrowing. The four telephone sub-accounts hold proportions of exactly 2.5 to 1.5 to 1 to 2 all year. And advertising, billed by one vendor in 24 bills, is exactly 2.6087% of journal product revenue every single month, which describes a fee formula rather than a media plan.
Four accounts move on their own: wages, in steps of 5% of January; payroll, which tracks wages; rent, which stepped from $12,100 to $13,310 in September; and advertising. Those four are the other half of operating expense, and they're the only half the report will size a saving on.
Since the Close, and the Limits
The subsequent-period section compares January through August 2026 with the same months of 2025. Revenue is up 18.7% and net income 85.6%, and every allocated pool grew by an identical 6.51%, which is the factor growing rather than consumption. Receivables rose 61.4% and inventory 109.4% since December. Inventory against the only cost of sales that relieves it works out to 661 days of supply rising toward 1,133, and the report says plainly that the general ledger can't tell whether that stock supports the wholesale business or sits beside it, and that the item subledger is the right source.
There's a section titled "What this statement cannot establish," and I think that it's the most useful page for a reader who wants to know how far to trust the rest. No returns or allowances posted in a year of 897 orders. No bad debt expense while $302K of invoices sat open. Freight-out has never been posted to, so the invoiced margin is overstated by an unknown amount. And the summary journals carry no customer, item, or location, so every customer-level finding in the report is measured on the 11.5% of revenue that came through invoices and stores.
Thirteen Recommendations, Each Sized or Marked Unmeasured
Six on revenue, seven on cost, ranked by dollars at stake. Each one carries either a dollar figure or the word "unmeasured," and each one names a verification step: which invoice to open, which report to run, which contract clause to read. The reclassification of interest expense is worth $24,694.63. The travel policy is worth $28,398.84, but only after the pool is posted from source. The freight recovery finding is unmeasured, because the shipping cost of 358 fulfillments isn't on the books at all.
How It Checks Itself
Before publication, 205 dollar figures in the draft were extracted and matched against a dictionary of values re-derived from the parsed rows and the transcribed reports, and 25 arithmetic identities were checked independently. The same check runs when the document is opened, and there's a control on the page to show any unmatched figure. The SuiteQL is in Appendix B, twelve queries with row counts, and the method, assumptions, and classification rules are in Appendix C.
Wrapping Up
The 42-account allocation and the four test invoices are the same account that the Ledger X-Ray read as a documentary and the Instance Integrity Diagnostic wrote up as a findings register. This prompt is the version for the person who has to present FY2025 and needs to know which numbers will survive a question.
Income Statement Review is in the paid tier of the library. The full sample report from the test account is online, and I covered the whole September release in a separate post.
When costs move in lockstep, they aren't costs. Someone should find out what the formula is before anyone tries to cut it.