Inventory problems come in three kinds. The stock you don't have when a customer wants it. The stock you have far too much of, sitting in a warehouse turning into cash you can't get back. And the supplier who was supposed to deliver and didn't. Most companies plan hard for the first, notice the second once a year at count time, and argue about the third from memory.
The Supply Chain and Inventory category of my NetSuite AI Prompt Library is seven prompts that cover all three from the records NetSuite already has: purchase orders, receipts, fulfillments, and item balances. This post goes through them, and closes with what one of them found when I pointed it at a real account.
If you're new to the library, it's a set of 150 prompts for NetSuite finance work that I released in January. Each one is a structured system prompt that you paste into Claude or ChatGPT along with your NetSuite data, and it turns the model into a specific kind of analyst with a defined method, a required output, and rules about what it's not allowed to make up.
Too Little
The Inventory Reorder Point Calculator is the classic planning problem made explicit. It casts the model as an inventory planning analyst and works through six blocks: demand analysis from twelve months of movement, lead time analysis from purchase orders and receipts, a service level framework, the reorder point calculation, safety stock, and the working capital impact. The formulas are stated in the prompt so the model can't improvise them: reorder point equals average daily demand times lead time plus safety stock, and safety stock equals a Z-score times demand variability times the square root of lead time. The Z-scores are tabulated, 1.65 for 95% service, 2.33 for 99%, and the choice of service level is flagged as a human decision, because it's a trade-off between stockouts and cash.
The output is a recommendations table, one row per item with current and recommended reorder points, safety stock, and priority, followed by a working capital table showing what the recommendations would do to inventory value and days on hand.
Too Late
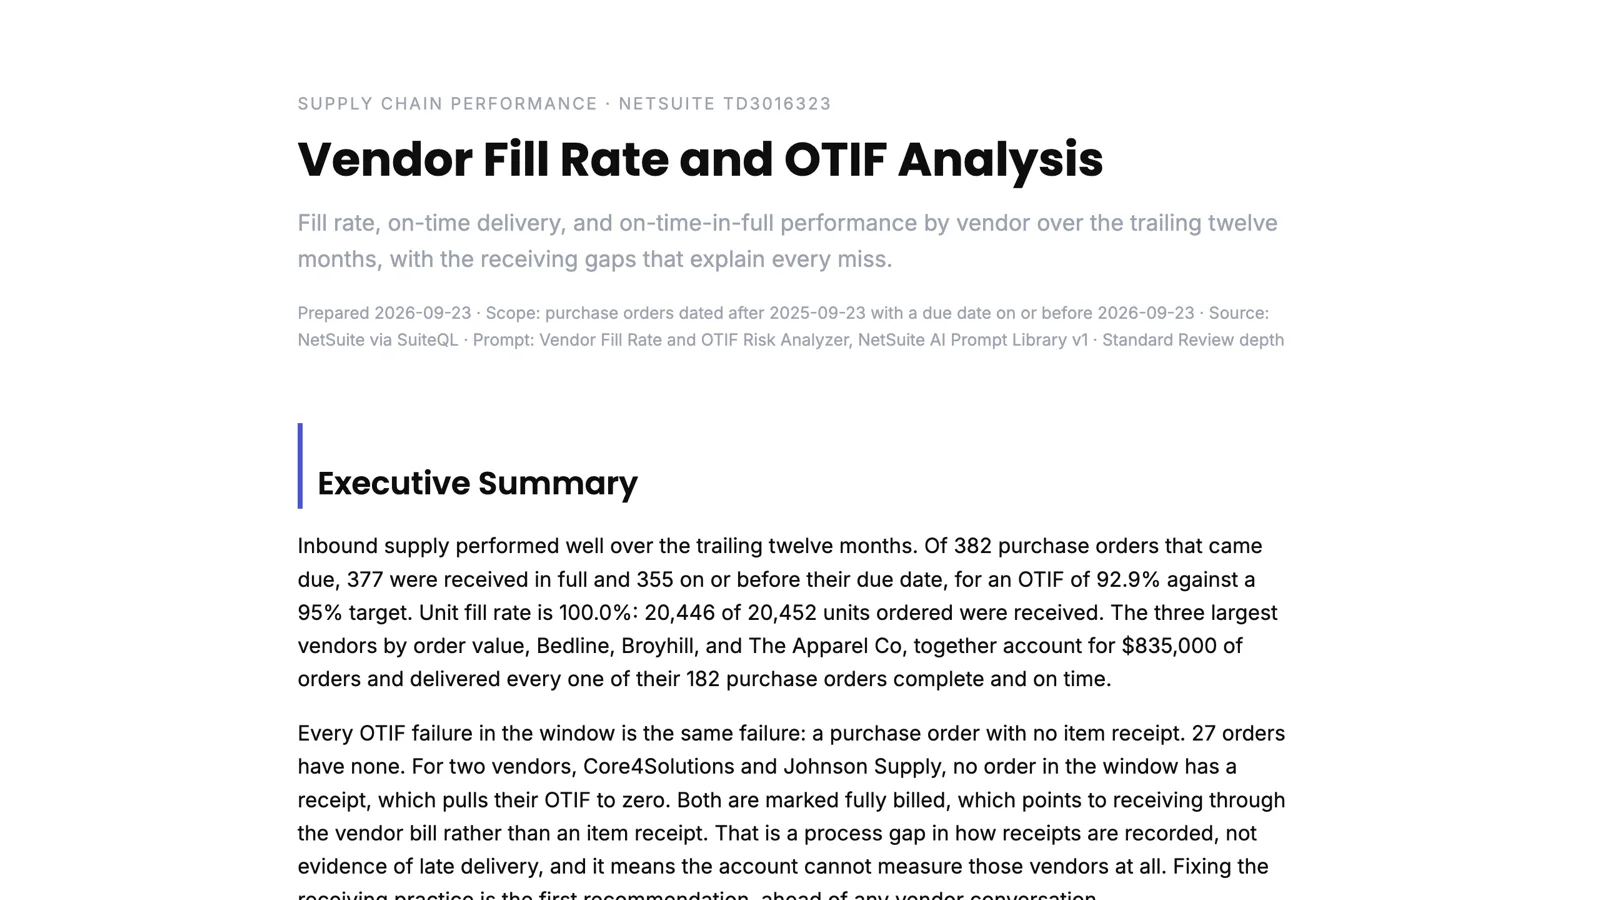
Three prompts look at suppliers. I wrote about the Vendor Fill Rate and OTIF Risk Analyzer last week, with a real run, so I'll only summarize it here: fill rate, on-time delivery, and on-time-in-full by vendor, with thresholds and a trend.
The Vendor Performance and Dependency Analyzer widens the lens from delivery to dependency. It measures spend concentration (a single vendor above 25% of spend is high risk, the top five above 70% is high risk), identifies single-source items, scores each vendor, and produces strategic recommendations that are flagged for human review because they're commercial decisions. The PO Trend and Supply Risk Analyzer watches the leading indicators: purchase order volume and value by month, lead time trends (a 25% increase is high risk), rush orders and period-end bunching, and vendor ordering patterns that have changed.
The Supply Chain Resilience Analyzer is the scenario prompt. Geographic concentration, vendor concentration, lead time exposure, and disruption scenarios with financial exposure, ending in a resilience scorecard. If more than 70% of spend sits in one region or more than 35% of items are single-sourced, it says so in red.
Too Much, and the Warehouse
The Procurement Spend Optimizer is the buying-side companion to the vendor spend analysis: spend by category and vendor, price variance for the same item across vendors (over 25% is high potential), maverick spend outside the purchase order process, tail spend, and early payment discounts captured or missed.
The Warehouse Efficiency Analyzer measures throughput, space utilization, productivity, accuracy, and cycle time by location, from receipts, shipments, adjustments, and bin data. Its thresholds are operational: order cycle time under a day is excellent, same-day ship above 90% is excellent, inventory accuracy under 97% needs improvement.
All seven are in the NetSuite AI Prompt Library, under Supply Chain and Inventory.
Update, September 2026
I ran the Inventory Reorder Point Calculator prompt from this group against one of my NetSuite test accounts, with the queries executed through Chartstone and the analysis done by Claude, and formatted the report to one of my branding guidelines. Here's what it found.
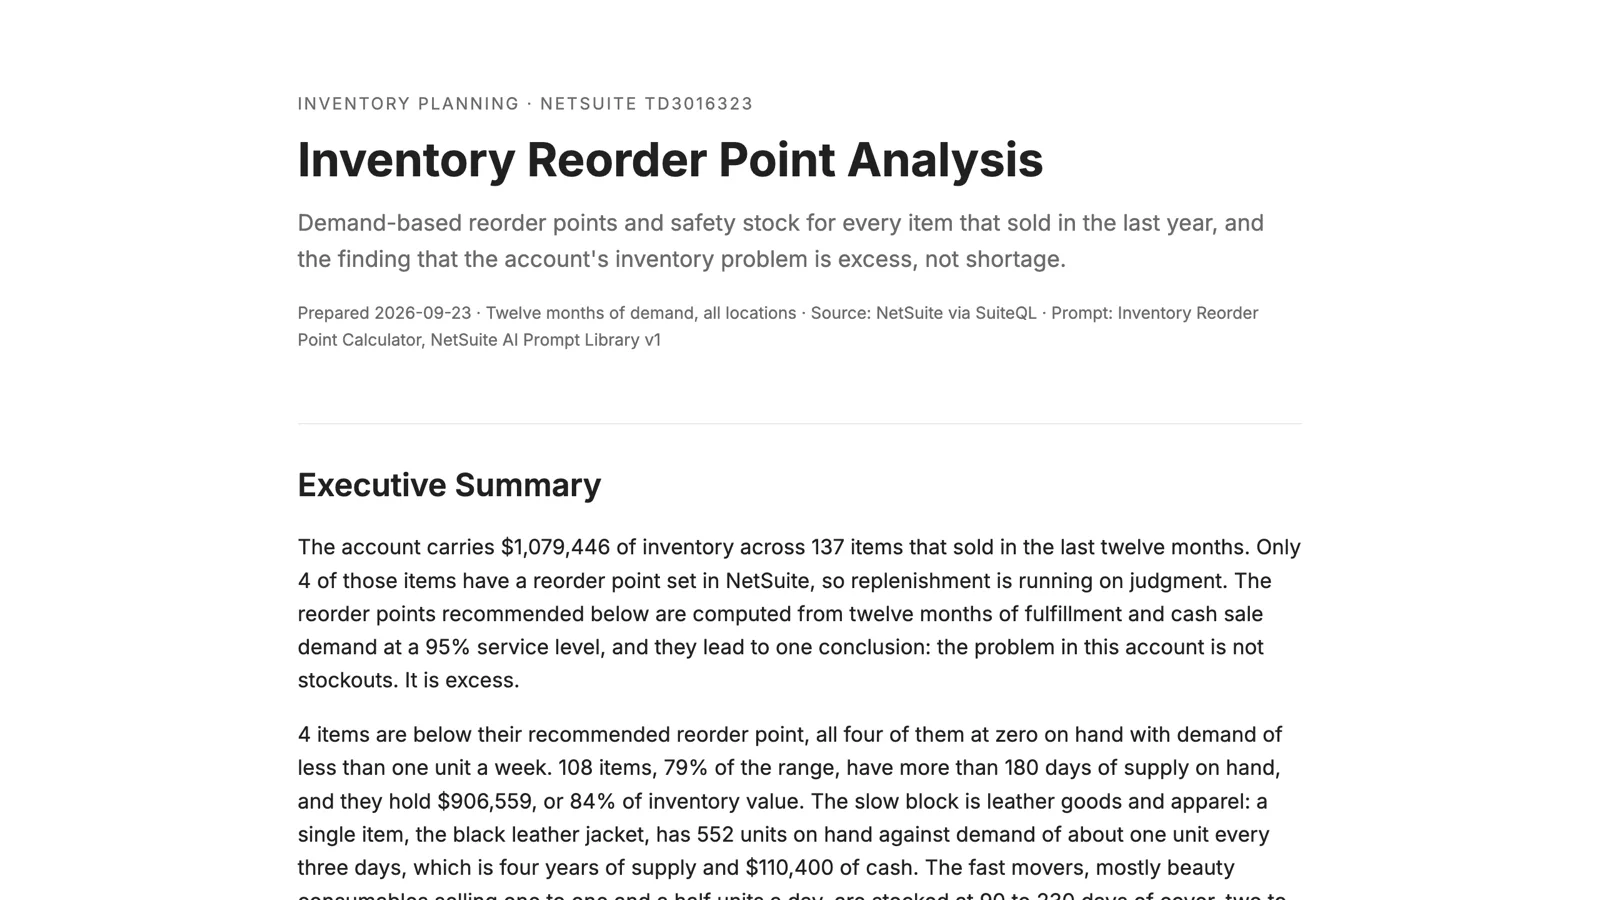
The account carries about $1.08 million of inventory across 137 items that sold in the last year, and only four of those items have a reorder point set in NetSuite. So the prompt computed them, at a 95% service level, from twelve months of fulfillments and cash sales. Four items were below their recommended reorder point, all of them at zero on hand with demand under a unit a week. That's the stockout problem, and it's small.
The other problem isn't. 108 items, four out of five in the range, have more than 180 days of supply on hand, and they hold $907,000, which is 84% of the inventory value. It's leather goods and apparel. One black leather jacket has 552 units on hand against demand of about one every three days, which is four years of supply and $110,400 of cash. The fast movers, mostly beauty consumables, are stocked at 90 to 230 days of cover, two to five times what their reorder points call for. The report's conclusion was that the account's inventory problem is excess, not shortage, and that the fix is a pricing decision on the slow block rather than a planning parameter.
It also flagged a data problem I've seen before in this account: every receipt is dated on the day of its purchase order, so lead time computes to zero and a reorder point built on it would be zero too. The report used a seven-day planning lead time, said so in a call-out at the top, and made recording real expected receipt dates its 90-day recommendation.
You can read the full report here: Inventory Reorder Point Analysis. The names and numbers are test data.