Most companies can name their worst vendor. Fewer can prove it. The purchase orders are in NetSuite, the receipts are in NetSuite, and the dates on both are in NetSuite, but nobody has put them side by side, so the vendor conversation happens on impressions. And impressions favor the vendor who complains loudest when you're late paying them.
The Vendor Fill Rate and OTIF Risk Analyzer is the prompt in my NetSuite AI Prompt Library that puts those records side by side. It computes the three numbers a vendor scorecard is built on, and it's careful about what they do and don't mean.
If you're new to the library, it's a set of 150 prompts for NetSuite finance work that I released in January. Each one is a structured system prompt that you paste into Claude or ChatGPT along with your NetSuite data, and it turns the model into a specific kind of analyst with a defined method, a required output, and rules about what it's not allowed to make up.
Three Numbers
Fill rate is what you received against what you ordered, and the prompt computes it three ways: by line, by unit, and by value, plus a first-time fill rate that counts only orders that arrived without a backorder. On-time is the receipt date against the promised date, with the average days early or late alongside it. OTIF is the two together: the share of orders that were both complete and on time. It's the number that supply chain people quote, and the prompt makes the model state the formula next to it every time.
Around those three sit the rest of the framework. A trend by quarter. Risk flags for vendors that are declining or below target. A rough cost of poor performance, in expediting and stockouts, where the data supports it. And a root cause section that sorts failures into fill failures, timing failures, quality failures, and documentation failures, because the fix for each is different.
What It Refuses to Do
The prompt's thresholds are explicit. OTIF above 93% is excellent, 85 to 93 is good, 75 to 85 needs improvement, and below 75 is critical. But the model isn't allowed to rate a vendor without the calculation behind it, and it isn't allowed to declare a trend without stating the period. Vendor-specific conclusions, contract recommendations, and root cause attributions all go to a person for review. The scorecard is evidence for the vendor meeting, not the verdict.
It's also required to say when the data can't answer the question. Missing receipts mean no fill rate. Missing promised dates mean no on-time measure. The prompt treats those as blocking gaps to report, not holes to paper over.
The Queries and the Output
Four SuiteQL queries ship with the prompt: fill rate by vendor from purchase order lines, on-time performance from receipts against due dates, the combined OTIF calculation, and a quarterly trend. With an MCP connector the model runs them. Without one, you run them in the SuiteQL Query Tool and paste the results in.
The output order is fixed: executive summary, the OTIF scorecard, component analysis, trend analysis, risk flags, and the data lineage and assumptions appendices. The scorecard is one row per vendor with fill rate, on-time, OTIF, the target, the gap, the trend, and a rating. The risk summary rolls vendors up by level with the spend at stake in each.
Who It's For
Procurement, first, because it's the vendor scorecard they've been meaning to build. Operations, for supply planning. And the CFO or controller who is about to renegotiate a contract and would like to walk in with the numbers.
It's in the NetSuite AI Prompt Library, under Supply Chain and Inventory.
Update, September 2026
I ran this prompt against one of my NetSuite test accounts, with the queries executed through Chartstone and the analysis done by Claude, and formatted the report to one of my branding guidelines. Here's what it found.
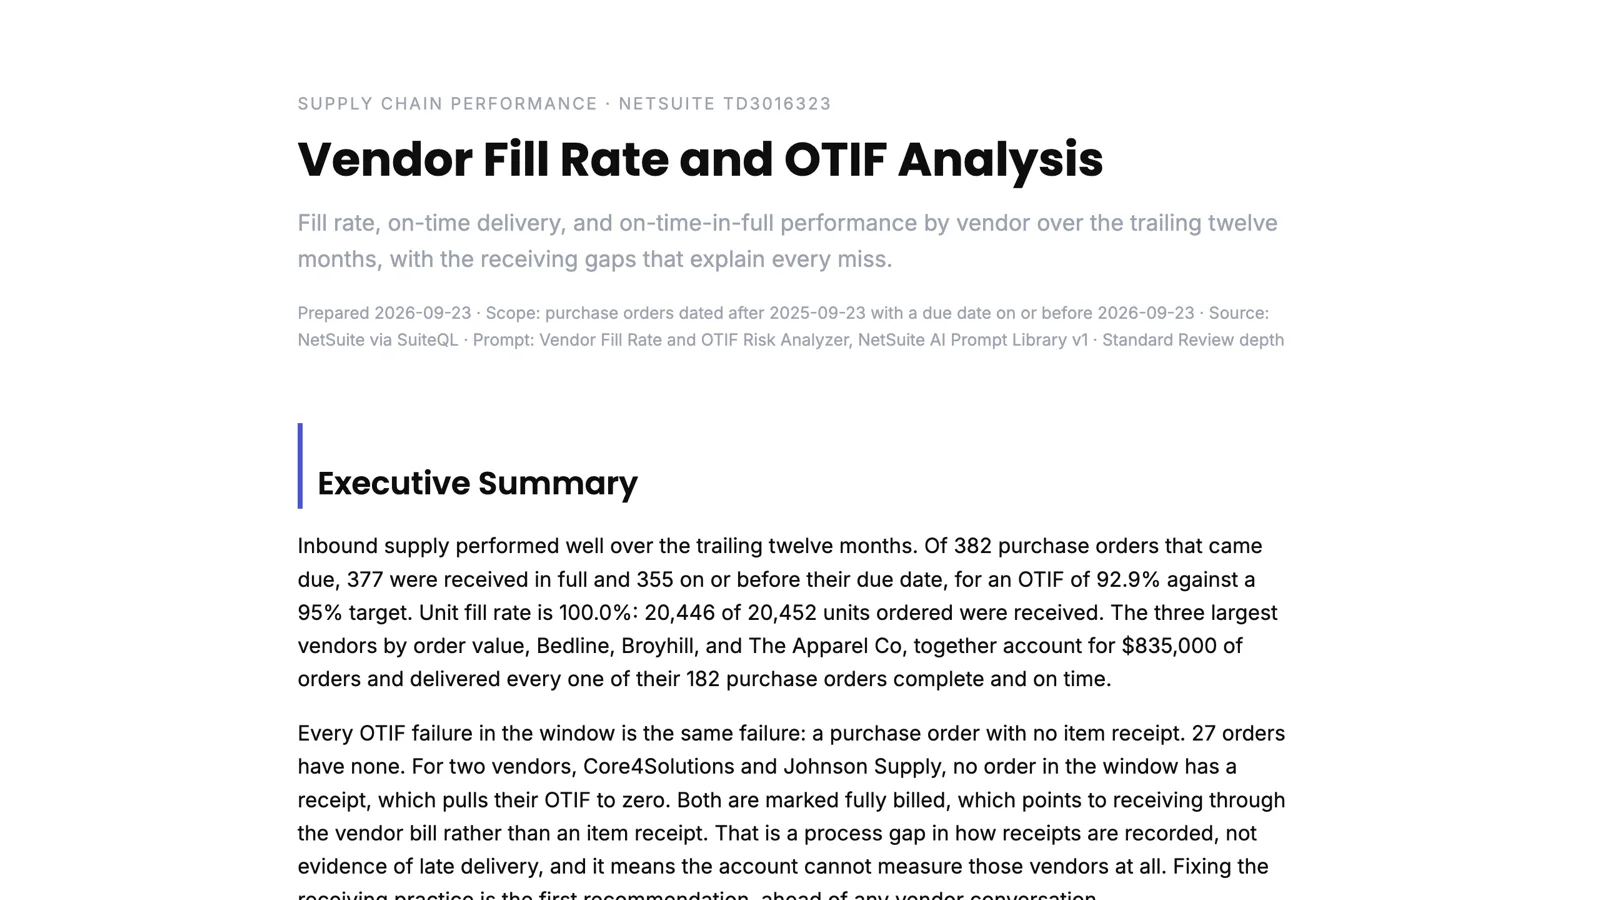
OTIF came out at 92.9% against a 95% target across 382 purchase orders, with a unit fill rate of 100%. The three largest vendors by order value delivered every one of their 182 orders complete and on time. So far, a good quarter for the supply base.
The interesting part was what the misses had in common. Every OTIF failure in the window was the same failure: a purchase order with no item receipt. Two vendors scored zero because none of their orders has a receipt, and every one of them is marked fully billed. That pattern means the goods were received against the vendor bill rather than an item receipt. It's a process gap in how receiving is recorded, not evidence of late delivery, and the report says so and puts fixing the receiving practice ahead of any vendor conversation.
It also said something I appreciated about its own metric. In that account every purchase order carries a due date three days after the order date, and receipts are dated on the order date, so every vendor is "three days early" and the on-time measure can't discriminate between them. The report puts that in a call-out at the top rather than burying it, and it recommends real expected-receipt dates as the 90-day action. A prompt that tells you when its headline number is uninformative is doing its job.
You can read the full report here: Vendor Fill Rate and OTIF Analysis. The names and numbers are test data.