Revenue problems rarely show up as one number. They show up as a discount that got approved a little too easily, a quote that went cold without anyone noticing, a territory that's carrying two reps' worth of accounts, or an invoice that was recognized in the wrong month. Each of those lives in a different corner of NetSuite, and each has a prompt in this group.
This is the second of two posts on the Revenue and Customer Analytics prompts in my NetSuite AI Prompt Library. The first was about customers: who pays, who's at risk, who's profitable. These seven are about the revenue itself: how it's priced, sold, structured, and recognized.
If you're new to the library, it's a set of 150 prompts for NetSuite finance work that I released in January. Each one is a structured system prompt that you paste into Claude or ChatGPT along with your NetSuite data, and it turns the model into a specific kind of analyst with a defined method, a required output, and rules about what it's not allowed to make up.
Pricing and Deals
The Pricing Optimization Analyzer compares list price to realized price by item, measures how often and how deeply items are discounted, groups sales into price bands, and looks at pricing by customer segment. Its thresholds: price realization above 95% is strong, below 85% a concern; discount frequency under 20% is strong, over 40% a concern; average discount depth under 10% is strong. It ends with an optimization priority list, and every price change, discount policy change, and segment strategy on it is flagged for human review.
The Deal Desk Analyzer is the same discipline applied one deal at a time. It's built for the moment a rep brings a non-standard deal to finance: it inventories the pending deal, analyzes its profitability, evaluates the terms, compares it to historical benchmarks and the customer's deal history, assesses the risk, and recommends. Gross margin above 35% is strong; a discount over 20% is a concern; a deal over $250,000 gets the full treatment. All deal approvals go to a person, as they should.
The Profitability Improvement Planner sits above both. It baselines profitability, identifies the levers across revenue, gross margin, operating expense, customers, products, and structure, quantifies each, assesses feasibility, ranks them, and builds a roadmap. Its materiality bar is a margin improvement above two points or more than $500,000, and it sorts initiatives into quick wins, projects, and transformations.
Quotes and Territories
The Quote Win Rate Analyzer reads estimates in NetSuite and computes win rates by count and by value, the conversion funnel, wins and losses by rep and by deal size, cycle time, and where pricing affected the outcome. Its thresholds are practical: a count win rate above 35% is strong, a sales cycle under 30 days is strong. It needs a reasonable volume of quotes to say anything, which is worth knowing before you run it.
The Sales Territory Analyzer evaluates territories on revenue, year-over-year growth, quota attainment, rep productivity, customer coverage, and capacity, and it models realignments. Quota attainment above 100% and revenue per rep above $1 million are its strong marks; customer activation below 50% is a concern. Territory realignment and quota implications are flagged for human review, because that's where the arguments are.
Recognition and Subscriptions
The Revenue Recognition Validator is the compliance prompt in the group. It reviews revenue transactions against ASC 606 and IFRS 15, validates timing, checks amounts, assesses contracts, rolls forward deferred revenue, and reports exceptions. Its risk indicators: cutoff exceptions under 1% are low risk, over 5% high; backdated invoices over 2% are high risk; a deferred revenue variance over 5% is high risk. Compliance conclusions and audit responses are for a person to sign.
The Subscription Revenue Tracker is for businesses with recurring revenue. It calculates MRR and ARR, builds cohorts, measures gross and net revenue retention and logo retention, and separates expansion from churn. Net revenue retention above 120% is strong, below 100% a concern; gross retention above 95% is strong. Investor-facing metrics are flagged for review before they go anywhere near an investor.
All seven are in the NetSuite AI Prompt Library, under Revenue and Customer Analytics.
Update, September 2026
I ran the Pricing Optimization Analyzer from this group against one of my NetSuite test accounts, with the queries executed through Chartstone and the analysis done by Claude, and formatted the report to one of my branding guidelines. The quote prompt didn't get a run because the account holds only ten estimates. Here's what the pricing run found.
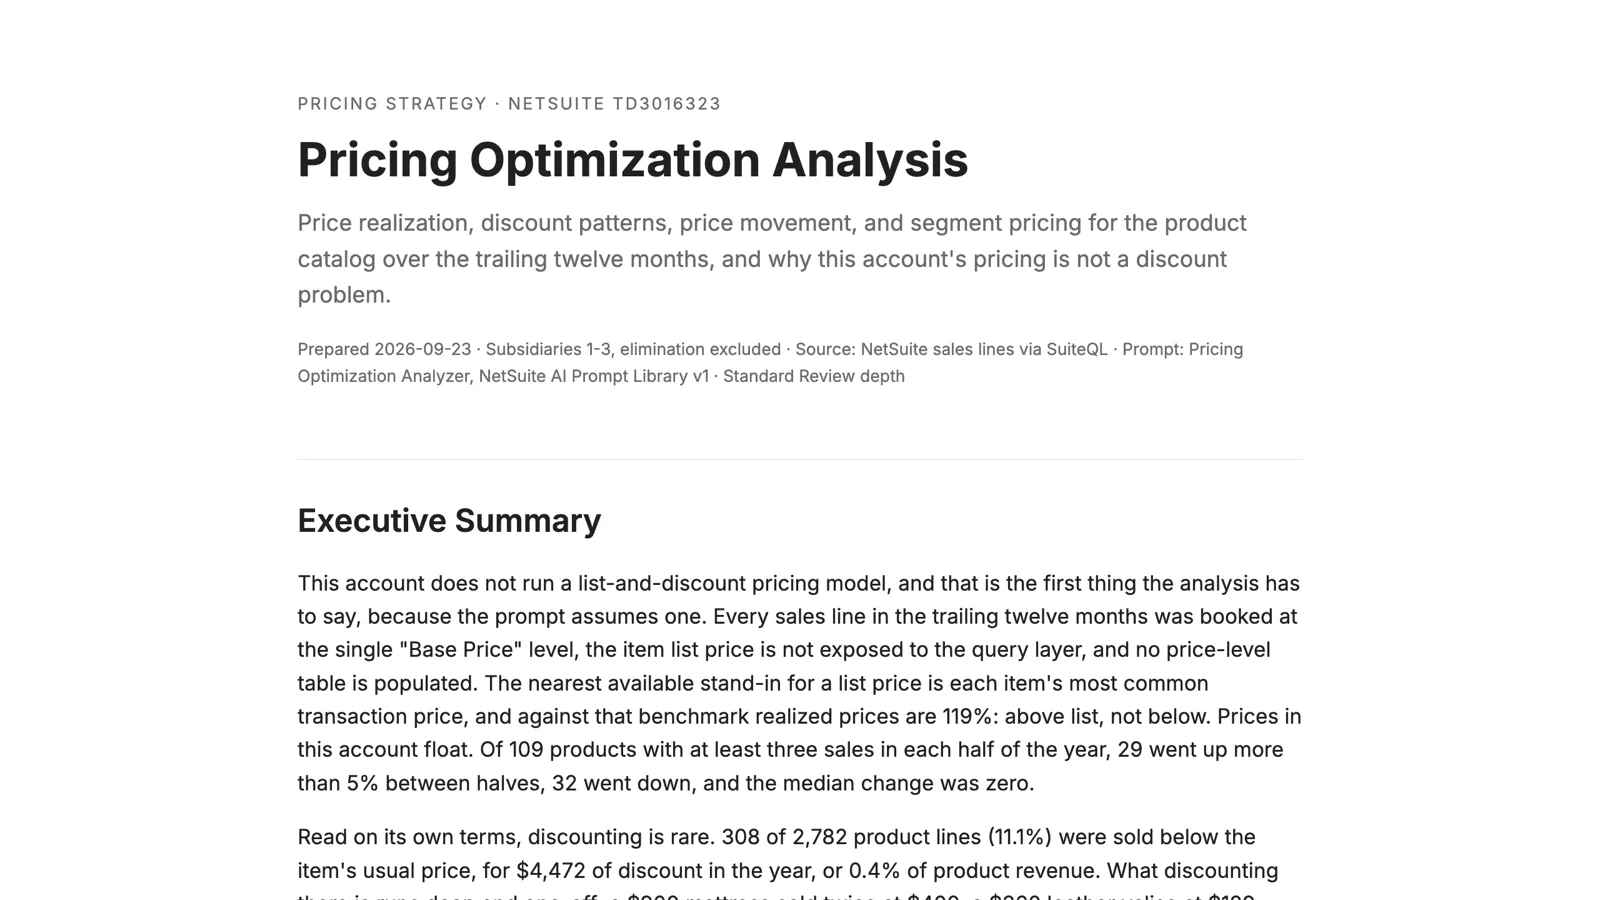
The first thing the report had to say was that the prompt's model of pricing doesn't fit this account. Every sales line in the year was booked at the single Base Price level, the item list price isn't exposed to the query layer, and the price-level table is empty. The prompt assumes a list price and discounts from it. This account has neither. Prices float: of 109 products with sales in both halves of the year, 29 went up more than 5% and 32 went down, and the median change was zero. So the report substituted each item's most common transaction price as the benchmark, said so in a call-out at the top, and measured against that.
On that basis, discounting is rare. 308 of 2,782 product lines, 11.1%, sold below the item's usual price, for $4,472 of discount in a year, which is 0.4% of product revenue. What discounting exists is deep and one-off: a $900 mattress sold twice at $400, a $360 leather valise at $129. Those few lines are the ones an approval policy is for. The 80 lines sold at zero, which the prompt's own discount query would have flagged as 100% discounts, turned out to be components of bundled sales that carry their price on another line of the same invoice. Not leakage.
The recommendation that came out on top wasn't a pricing change. It was to maintain a list price on the item record, because without one, price realization can't be measured at all. I think that's the right answer, and I'd rather have a prompt that says "you can't measure this yet" than one that produces a realization percentage from a benchmark it invented.
You can read the full report here: Pricing Optimization Analysis. The names and numbers are test data.