Operations questions have operations answers, and most of them are sitting in the transaction tables. Which location is slow. How long an order really takes from entry to cash. Whether the warehouse is behind or the sales team is over-promising. The data to answer those is in NetSuite, in sales orders, fulfillments, receipts, and invoices, and the analysis is a matter of putting the dates side by side.
This is the second of two posts on the Operational Intelligence prompts in my NetSuite AI Prompt Library. The first covered the management view: KPI dashboard, benchmarks, capacity, and department scorecards. This one covers the four that measure how the operation runs: location comparison, order fulfillment, process cycle time, and resource utilization.
If you're new to the library, it's a set of 150 prompts for NetSuite finance work that I released in January. Each one is a structured system prompt that you paste into Claude or ChatGPT along with your NetSuite data, and it turns the model into a specific kind of analyst with a defined method, a required output, and rules about what it's not allowed to make up.
Location Performance Comparator
The model becomes an FP&A analyst comparing locations, subsidiaries, or business units on the same footing. Financial performance by subsidiary and by location, transaction volumes, and customer counts, four queries, then variance against the average and against the best performer, and a normalization step, per employee, per square foot, per transaction, so that a big location and a small one can be compared honestly. A gap over 20% to the average gets detailed analysis; under 10% gets a note. The deliverable ends with the best performer's practices, which is the part managers actually use.
Order Fulfillment Performance Tracker
This is the warehouse prompt. The model becomes an operations analyst and works through six blocks: fill rates (order, line, unit, and perfect order), on-time delivery against the promised date with average days to ship, backorder count, value, aging, and lost sales, fulfillment cost per order, performance by customer segment, and root cause analysis. Four queries ship with it: order fill rate by month, on-time delivery, backorders, and fulfillment cost.
The materiality framework is two numbers. A fill rate under 90% or on-time delivery under 85% is a high gap that gets detailed analysis. Above 95% and 92% is monitor only. The output is a scorecard with current, prior, target, gap, and trend for each metric, followed by a root cause table that sorts failures into stock-outs, operational delays, carrier issues, and system or process errors, with the orders and dollars in each. Root cause attributions are flagged for human review, because the data shows where an order waited and not always why.
Process Cycle Time Calculator
The cycle time prompt measures the three processes that finance lives in. Order-to-cash, from order entry to cash collection. Procure-to-pay, from requisition to vendor payment. Record-to-report, from period end to close. Plus quote-to-order and two others where the data exists. The model becomes a process improvement analyst, computes each cycle from the transaction dates, breaks it into stages to find the bottleneck, and translates days into working capital: a five-day improvement worth over $100,000 of working capital is high materiality, under two days and $25,000 is a note. Three queries ship with it, one per core process. The cash flow block is what makes this prompt a finance prompt rather than an operations one.
Resource Utilization Analyzer
The last prompt is for businesses that track time and cost to projects. The model becomes a resource planning analyst and compares actual usage with available capacity, costs against value delivered, over- and under-allocation across projects and departments, patterns over time, and projected utilization from the pipeline. Three queries: costs by project, costs by department and class, and time entries by project and employee. Over 20% under- or over-utilized is a high gap. The rebalancing recommendations at the end name specific moves, and every one of them is flagged for a person, since moving people is not something a report should do.
Who They're For
COOs and operations managers first. Controllers who want cycle time in days and dollars. And anyone running more than one location who suspects that one of them is carrying the others. All four are in the NetSuite AI Prompt Library, under Operational Intelligence.
Update, September 2026
I ran the Order Fulfillment Performance Tracker prompt from this group against one of my NetSuite test accounts, with the queries executed through Chartstone and the analysis done by Claude, and formatted the report to one of my branding guidelines. Here's what it found.
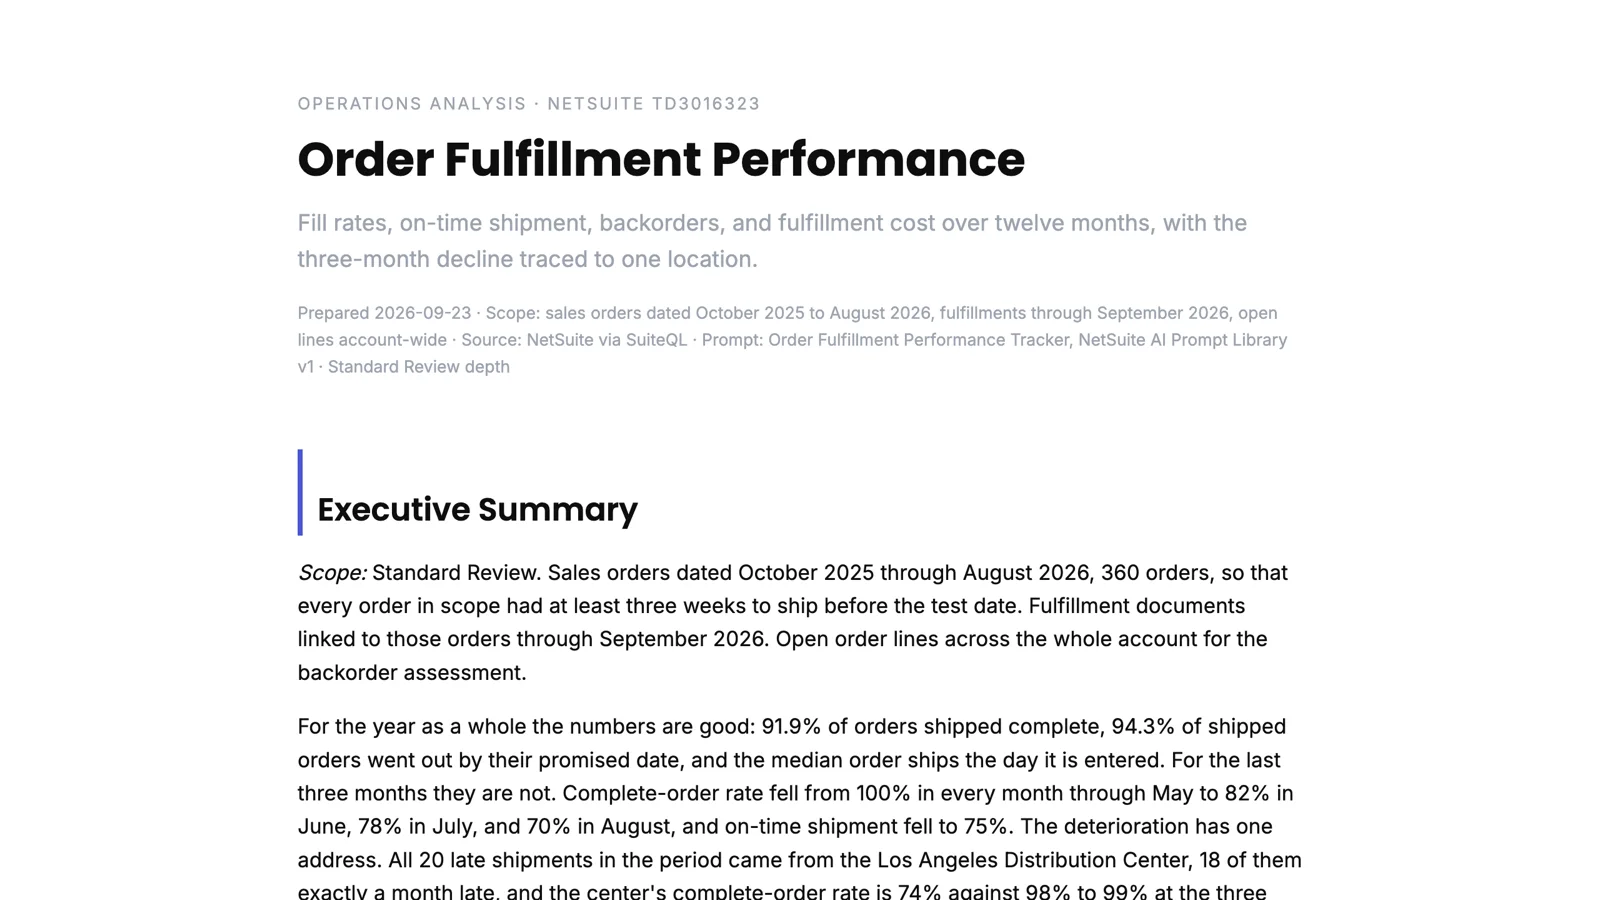
For the year as a whole the numbers looked fine: 91.9% of 360 orders shipped complete, 94.3% of shipped orders went out by their promised date. Then the report split it by month. Every month from October through May was 100% complete and 100% on time. June was 82%, July 78%, August 70%. And it split it by location: the three stores were at 98% to 99% complete, and the Los Angeles Distribution Center was at 74%. All twenty late shipments in the year came from that one building, and eighteen of them shipped exactly a month late against a fifteen-day promise, which means a queue that was cleared in one pass in September.
The backorder section added the part that matters at period end. There are 222 open lines on 73 orders, worth at least $121,000, and nineteen of those orders are already billed without having shipped. Customers have been invoiced for goods still in the warehouse. Four items appear on sixteen orders each in the same quantities, which the report reads as a kit being sold as components and names as the first place to look for a stock-out. And shipping charged to customers went from about $300 a month to $6,200 in August, in step with the delays.
Two things about the run I'd point to. The report says up front that fulfillments in this account are dated on the order date, so days-to-ship is zero and the on-time metric can't discriminate unless an order waits a month. It doesn't pretend the average lead time means something. And the fulfillment cost block came back as a data gap, because the account doesn't expose shipping cost on fulfillments, so the report used shipping charged to customers as a proxy and labeled it as one. The prompt asks for cost per order; the honest answer was that it couldn't be computed, and that's what it said.
You can read the full report here: Order Fulfillment Performance. The names and numbers are test data.