A forecast is a number with a story attached, and the story is the part that gets questioned. Why does it go up in the fourth quarter? What's the confidence range? What happens if the biggest customer cuts volume by a fifth? A forecast that can't answer those questions isn't a forecast. It's a hope with a spreadsheet.
This is the second of two posts on the Budgeting, Forecasting and Planning prompts in my NetSuite AI Prompt Library. The first covered the budget itself. These seven are about looking forward: forecasting revenue, rolling the forecast each month, modeling scenarios, scoring an investment, and knowing which product lines the plan should lean on.
If you're new to the library, it's a set of 150 prompts for NetSuite finance work that I released in January. Each one is a structured system prompt that you paste into Claude or ChatGPT along with your NetSuite data, and it turns the model into a specific kind of analyst with a defined method, a required output, and rules about what it's not allowed to make up.
Forecasting Revenue
The Revenue Forecasting Tool works from monthly revenue history in NetSuite. It analyzes the trend, detects seasonality and builds a seasonality index, identifies the drivers, generates the forecast, and states its confidence. The confidence framework is explicit: one month out is high confidence with a range of plus or minus 5 to 10%; three months out is medium, plus or minus 10 to 15%; twelve months out is lower, plus or minus 15 to 25%. Every forecast it produces carries that range, and every forecast is flagged for human review before it's used for a target or a quota.
There are two Rolling Forecast Generators in the library, and that's deliberate. One takes the budgeting perspective: integrate the actuals to date, update the drivers, rebuild revenue and expense, compare to budget, and list the decisions needed. The other takes the performance perspective: trend-based projection, seasonality adjustment, and accuracy tracking, so that each month's forecast is scored against what happened. If you own the budget you want the first. If you own the number you want the second.
Modeling What Might Happen
The Scenario Modeling Assistant builds a baseline from the current financial position, identifies the variables that matter, constructs best, base, and worst cases, projects each, and produces a risk-weighted outlook. The default probabilities are 20% best, 60% base, 20% worst, and the prompt tells the model to adjust them from market conditions and the historical trend rather than leave them at the defaults. Its queries pull the financial baseline, the monthly revenue trend, the cost structure, and revenue by segment.
The What-If Scenario Modeler is the single-question version. Something specific is on the table, a price change, a new hire, a second location, and the question is what it does to the numbers. The prompt documents the base case, models the scenario against it over multiple years, runs the sensitivity, includes a break-even analysis, and ends with a decision framework and go/no-go criteria. All of the inputs and the recommendation itself are flagged for human review.
The Investment ROI Calculator handles capital decisions. It quantifies the investment, projects the benefits and the cash flows, and computes NPV, IRR, payback, and simple ROI, then runs a sensitivity and a risk assessment. The thresholds are the ones a finance committee would use: positive NPV, IRR above the cost of capital plus five points, payback under two years, simple ROI above 25%. It pulls historical capital spending, the operating cost baseline, and the revenue trend from NetSuite so the benefit assumptions have something to stand on.
Knowing What to Plan Around
The Product Line Profitability Analyzer is here because a plan that doesn't know which products make money is a plan built on the wrong assumptions. It computes revenue, direct cost, and gross margin by product line and by product, ranks them, sorts them into a portfolio matrix of stars, cash cows, question marks, and dogs, and shows each line's share of revenue against its share of profit. Gross margin above 50% is strong, 30 to 50% acceptable, below 30% a concern.
It has one deliberate gap: indirect cost allocation is a block in the framework, but the prompt requires a person to choose the allocation basis. Cost allocation decisions, discontinuation recommendations, and pricing implications all go to human review. The model ranks. It doesn't retire a product line.
All seven are in the NetSuite AI Prompt Library, under Budgeting, Forecasting and Planning.
Update, September 2026
I ran the Product Line Profitability Analyzer from this group against one of my NetSuite test accounts, with the queries executed through Chartstone and the analysis done by Claude, and formatted the report to one of my branding guidelines. Here's what it found.
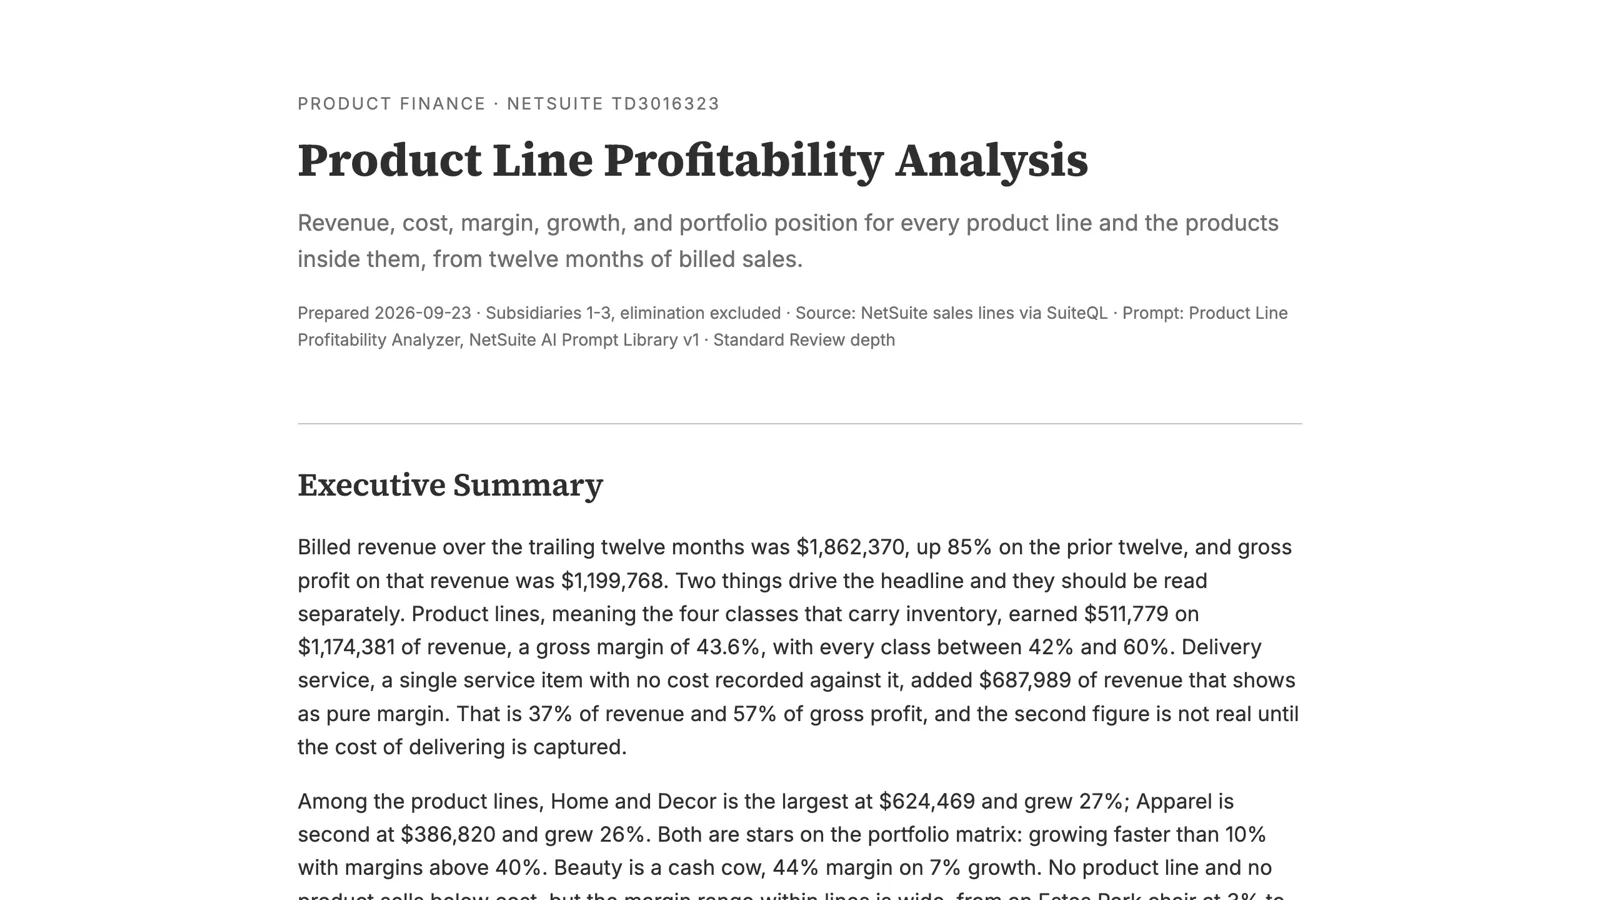
Billed revenue over the trailing twelve months was $1.86 million, up 85% on the year before, with a gross margin of 43.6% across the four product lines that carry inventory. Home and Decor is the largest at $624,000 and grew 27%. Apparel is second at $387,000 and grew 26%. Both land in the star quadrant, growing faster than 10% with margins above 40%. Beauty is a cash cow, 44% margin on 7% growth. Nothing sells below cost.
The finding was about the fifth line. A single delivery service item accounts for 37% of billed revenue and, because no cost is recorded against it, shows as 57% of gross profit at a 100% margin. The report refused to treat that as real. It rated the line "cost not captured," excluded it from the portfolio matrix, and made capturing the delivery cost the first recommendation, ahead of anything about products. Until that's fixed, every mix statistic in the account is distorted by it.
Inside the product lines the range was wide. The Contour Rhapsody Breeze mattress line is eight of the top twelve products by gross profit and roughly doubled in every size, on a 38% margin, so its contribution comes from volume. And one item stood out the other way: an Estes Park chair earning 2.7% on $9,500 of sales while the ottoman, chest, and headboard in the same collection earn 49%. The report's read is that a single item in an otherwise healthy collection usually means a costing or pricing error rather than a product problem, and it said to check the item record before drawing any conclusion about demand.
You can read the full report here: Product Line Profitability Analysis. The names and numbers are test data.