A budget is a stack of assumptions with numbers attached, and most of the work isn't building it. It's defending it. Why is revenue growth 12% and not 8%? What happens to the plan if the freight rate goes up? Which department is over, by how much, and is that a timing problem or a real one? Those questions arrive every month for the rest of the year, and in most finance teams they're answered from memory and a spreadsheet nobody else can open.
The Budgeting, Forecasting and Planning category of my NetSuite AI Prompt Library has sixteen prompts. This post covers the first seven, which are the ones about the budget itself: what went into it, how it's tracking, and where the business stops making money. The forecasting and scenario prompts are in a second post.
If you're new to the library, it's a set of 150 prompts for NetSuite finance work that I released in January. Each one is a structured system prompt that you paste into Claude or ChatGPT along with your NetSuite data, and it turns the model into a specific kind of analyst with a defined method, a required output, and rules about what it's not allowed to make up.
Writing the Assumptions Down
The Annual Budget Assumptions Documenter exists because the assumptions behind a budget are usually in someone's head, and that someone eventually leaves. It asks the model to organize every assumption by area, document each one with its rationale and its source, map the dependencies between them, and run a sensitivity on the ones that matter. It pulls historical trend data from NetSuite so that each assumption can be compared to what actually happened last year.
What I like about it is the approval framework. An assumption with more than $500,000 of impact needs full documentation and CFO sign-off. Between $100,000 and $500,000, standard documentation and a VP. Below that, the owner is responsible. The output ends with a sign-off section and a change log, which is the part that makes the document useful in month nine, when the question is "who decided that, and when?"
The Budget Commentary Writer is its companion for the board package. It takes the approved budget and the prior year's actuals and writes the narrative: the revenue plan, the margin story, the operating expense discussion, the investment highlights, the risk factors, and a bridge from last year. The model is cast as a CFO, and every piece of it is flagged for human review before it goes out, because it's the kind of writing that commits the company to things.
Diagnosing the Variances
The Budget Variance Diagnostic Tool is the monthly workhorse. It compares budget to actual from NetSuite's budget records, decomposes revenue and expense variances, sorts them by materiality, and then does root cause work on the ones that clear the bar. Critical is over $100,000 or 25%; significant is $25,000 to $100,000 or 10 to 25%; below that gets a standard review. It ships with five queries: the budget versus actual summary, variances by department, the monthly trend, expense detail for the root cause work, and the year-to-date position.
The Expense Budget Analyzer goes deeper on the cost side. Category by category, it explains variances, separates fixed from variable behavior, computes efficiency metrics, compares to the prior year, and proposes optimization opportunities and a reforecast. Its queries pull expenses by category, by vendor, and by department, which is the three-way view you need to tell whether a category is over because of price, volume, or a new vendor.
Both prompts flag every root cause conclusion and every corrective action for human review. They diagnose. A person decides what to do about it.
Allocating and Tracking
The Cost Allocation Modeler handles the part of budgeting that generates the most arguments: how overhead gets spread across segments. It identifies the cost pools, evaluates the allocation drivers, computes the rates, runs the allocation, and shows the impact on each segment's profitability. It ships with queries for the overhead pools, revenue by segment, department expenses, transaction counts by segment, and product volumes, so the driver choice can be tested against real data. A driver correlation above 70% is good; below 50% is a concern, and the model has to say which it found.
The Goal Attainment Tracker is the simplest of the seven and possibly the most used. Revenue goals, profitability goals, operational goals, and strategic goals, each with progress to date, a projection of where it lands at the current pace, and a status. Above 100% is exceeding, 90 to 100% is on track, 75 to 90% is at risk. It's the one-page view a leadership team wants on the first of the month.
Where Break-Even Really Is
The Break-Even Analysis Tool is the prompt in this group that I'd pick if I could only keep one, because break-even is the number every other budget conversation is secretly about. It classifies costs as fixed or variable from their behavior in the ledger, computes contribution margin by product, calculates break-even in revenue and in units, and reports the margin of safety and the degree of operating leverage. Its thresholds are stated: a margin of safety above 30% is healthy, below 15% is risky; operating leverage below 3x is healthy, above 5x is risky.
It ends with a sensitivity table, base case against optimistic and pessimistic, and it flags cost classification decisions, pricing recommendations, and volume targets for human review. The cost classification flag matters more than it sounds, and the run below shows why.
All seven are in the NetSuite AI Prompt Library, under Budgeting, Forecasting and Planning.
Update, September 2026
I ran the Break-Even Analysis Tool from this group against one of my NetSuite test accounts, with the queries executed through Chartstone and the analysis done by Claude, and formatted the report to one of my branding guidelines. The test account has no budget records, which is why the variance and goal prompts didn't get a run. Here's what the break-even run found.
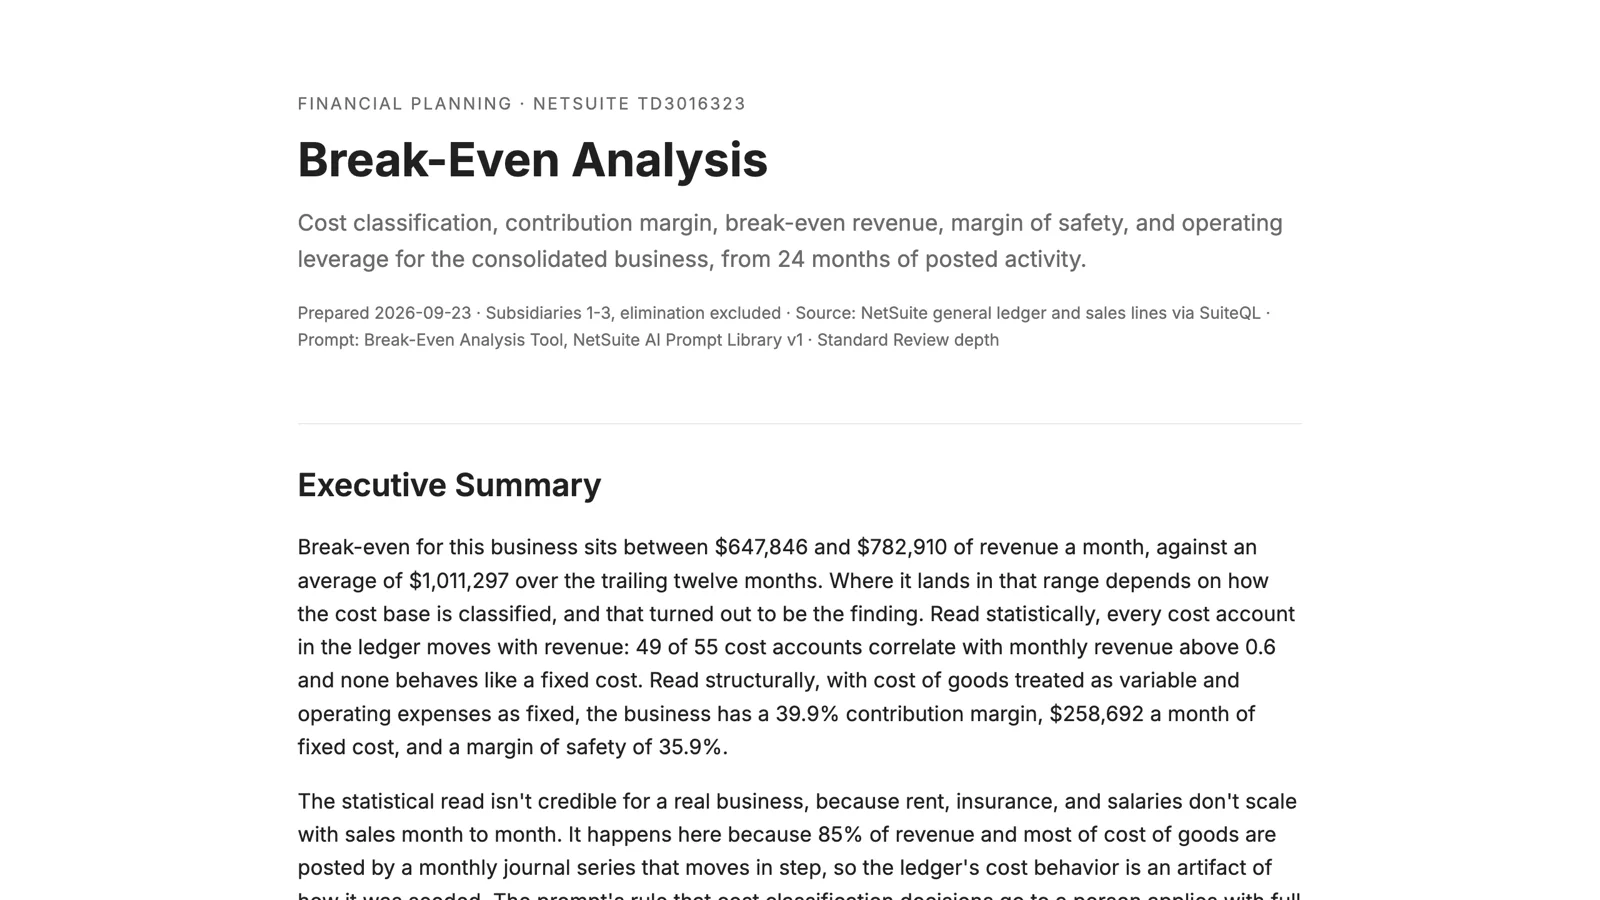
Break-even came out between $648,000 and $783,000 of revenue a month, against an average of just over $1 million. The range is the finding. The prompt's first step is to classify costs by how they behave, and in this account every cost account moves with revenue: 49 of 55 correlate with monthly sales, and not one behaves like a fixed cost. Rent and salaries included. That's not how a real business works, and the report says so. It happens because 85% of the account's revenue and most of its cost of goods are posted by a monthly journal series that scales together, so the ledger's cost behavior is an artifact of how the data was seeded.
So the report did what the prompt tells it to do when classification fails: it flagged the decision for a person, and it ran a second model on a structural classification, with cost of goods variable and operating expenses fixed. That version gives a 39.9% contribution margin, $259,000 a month of fixed cost, break-even at $648,000, a 35.9% margin of safety, and operating leverage of 2.8x. Healthy on both of the prompt's thresholds. The pessimistic scenario, volume down 20% and unit cost up 10%, stays above break-even by a narrow margin, which is what a 36% margin of safety means in practice.
Two things I'd take from it. A prompt that has to classify costs statistically needs a real ledger to do it against, and it should notice when it doesn't have one; this one did. And the regression it ran on the ledger as posted had an R-squared of 0.51, which it reported rather than hid. That's the behavior I want from every prompt in the library.
You can read the full report here: Break-Even Analysis. The names and numbers are test data.