A NetSuite OneWorld account is several companies pretending to be one. Each subsidiary has its own ledger, and the group has questions that no single ledger answers. Which entity is actually performing? What do they owe each other, and does it net to zero? How should shared costs be spread? What happens to the numbers when a subsidiary reports in a different currency? And where is the group's tax exposure?
The Multi-Entity and Consolidation category of my NetSuite AI Prompt Library is five prompts for those questions. This post goes through them and closes with a run of one of them against a real account.
If you're new to the library, it's a set of 150 prompts for NetSuite finance work that I released in January. Each one is a structured system prompt that you paste into Claude or ChatGPT along with your NetSuite data, and it turns the model into a specific kind of analyst with a defined method, a required output, and rules about what it's not allowed to make up.
Comparing the Entities
The Subsidiary Performance Comparator casts the model as a corporate finance analyst and ranks subsidiaries on revenue, profitability, growth, efficiency, balance sheet health, and strategic contribution. Its queries compute revenue share and rank, gross and operating margin, growth against the prior period, and revenue per employee, and its scorecard averages the ranks into a tier: top performer, strong, average, or needs attention. The thresholds are plain: operating margin above 15% is top tier, growth above 20% is high growth, revenue per employee above $200,000 is efficient. Tier assignments, strategic recommendations, and any conclusion about an underperformer are flagged for human review, because a ranking is an input to a decision rather than the decision.
Eliminating and Allocating
The Elimination Entry Generator does the consolidation work that NetSuite automates only partly. It identifies intercompany accounts that need elimination, matches intercompany revenue to expense, generates the entries with line detail, validates them, and runs a completeness check. Its tolerances are tight: a residual balance over $1,000 is high risk, an entry that doesn't balance by more than a dollar is high risk, and three or more intercompany accounts with no elimination is high risk.
The Shared Services Allocator handles the other direction: spreading corporate overhead, IT, HR, and finance costs across entities on defensible drivers. Revenue, headcount, and usage are the driver options, and the prompt makes the model show the allocation under each and quantify how much a change in methodology moves the result. More than 15% impact from a methodology change is high risk, because that's the point at which the allocation is deciding the margins rather than reporting them.
Currency and Tax
The Currency Translation Analyzer is the prompt for groups with subsidiaries in more than one functional currency. It translates the balance sheet and income statement, computes the cumulative translation adjustment, analyzes each subsidiary's exposure, and runs a rate sensitivity, against the ASC 830 and IAS 21 rules it cites. A rate movement over 15% is high risk, and a CTA change over 15% of net income is high risk. The account I ran the comparator against is entirely in US dollars, so this prompt has nothing to translate there, and under its own rules a missing foreign subsidiary balance is a blocking gap it reports rather than works around.
The Global Tax Position Analyzer computes pre-tax income by jurisdiction, effective tax rates and their variance, current and deferred tax, and a transfer pricing summary from intercompany transactions. Its risk table is in the language a tax director uses: an ETR variance over 5% is high risk, transfer pricing over $10M needs documentation, and uncertain positions are called out. Every conclusion goes to a person, because tax positions are not a thing a model decides.
All five are in the NetSuite AI Prompt Library, under Multi-Entity and Consolidation.
Update, September 2026
I ran the Subsidiary Performance Comparator prompt from this group against one of my NetSuite test accounts, with the queries executed through Chartstone and the analysis done by Claude, and formatted the report to one of my branding guidelines. Here's what it found.
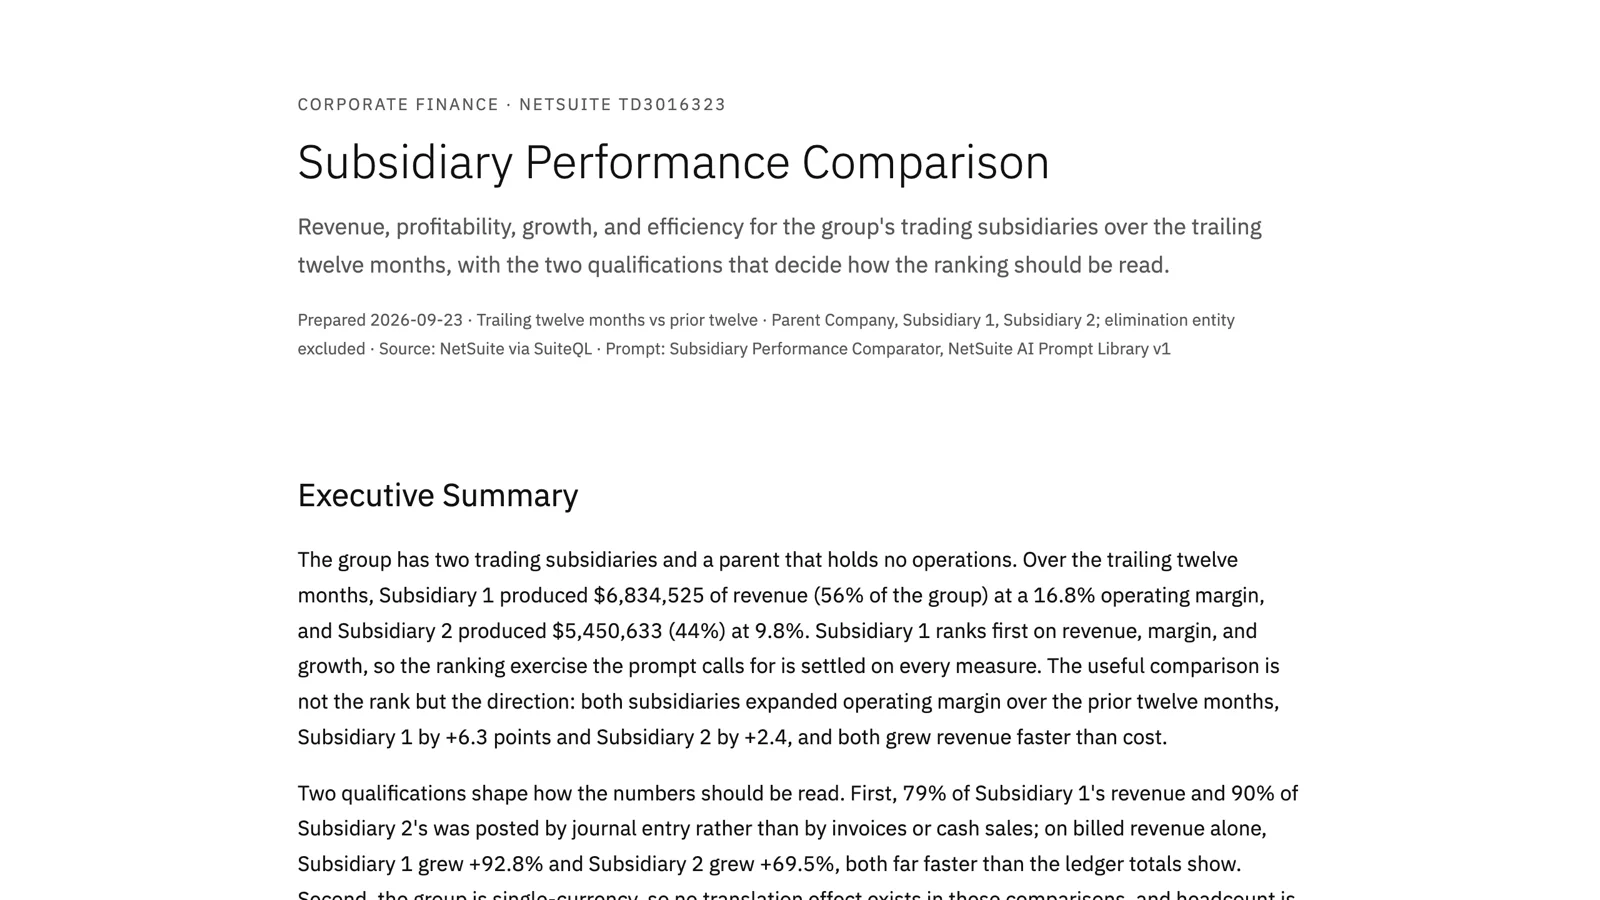
The group has two trading subsidiaries and a parent that holds nothing. Subsidiary 1 produced $6.8 million of revenue at a 16.8% operating margin; Subsidiary 2 produced $5.5 million at 9.8%. Subsidiary 1 ranked first on revenue, margin, and growth, so the ranking the prompt exists to produce was settled before the second page. The report said so, and then did the more useful thing: it compared direction. Both entities expanded their operating margin over the prior year, Subsidiary 1 by 6.3 points and Subsidiary 2 by 2.4, and both grew revenue faster than cost.
Two qualifications shaped the reading. About 80% of Subsidiary 1's revenue and 90% of Subsidiary 2's was posted by journal entry rather than by invoices; on billed revenue alone, they grew 93% and 70%. And the headcount records say 27 employees and one. One person can't generate $5.5 million, so either the entity is run by the parent's staff or by Subsidiary 1's, and the report pointed out that a shared-services allocation would move cost between the two and change both margins. That's exactly the question the Shared Services Allocator above is for.
It also noticed where the group's balance sheet risk sits. $791,000 of open receivables in Subsidiary 1, 87% past due, against $136,000 in Subsidiary 2. The ranking says Subsidiary 1 is the top performer. The receivables say it's also where the collections problem lives.
You can read the full report here: Subsidiary Performance Comparison. The names and numbers are test data.