Financial statements are easy to produce from NetSuite and hard to explain. The balance sheet says receivables went up. It doesn't say whether that's growth or a collections problem. The income statement says EBITDA, if you've computed it, but not which adjustments got you there or whether a lender would accept them. And the narrative that goes with the statements, the two pages a board actually reads, gets written last and fastest.
The Financial Statement Analysis and Reporting category of my NetSuite AI Prompt Library has eighteen prompts. This post covers the seven that work on the statements themselves. A second post covers management reports, period comparisons, segments, and trends.
If you're new to the library, it's a set of 150 prompts for NetSuite finance work that I released in January. Each one is a structured system prompt that you paste into Claude or ChatGPT along with your NetSuite data, and it turns the model into a specific kind of analyst with a defined method, a required output, and rules about what it's not allowed to make up.
The Balance Sheet Over Time
The Balance Sheet Trend Analyzer reads the balance sheet at several dates and asks what moved and whether it should have. Liquidity, working capital, assets, liabilities, and equity, each trended, with the ratios that go with them: current and quick ratios, debt to equity, and the three efficiency measures, days sales outstanding, days inventory outstanding, and days payable outstanding. It screens for red flags and ranks them by severity with the evidence attached.
Its materiality framework decides what gets attention. A balance above 10% of total assets or a change above 20% gets detailed analysis; 5 to 10% gets a summary; below that is noted only if there's a pattern. And it has a hard list of things a person has to see: any liquidity warning, any covenant concern, any recommendation to restructure debt or raise capital, and any material balance change it can't explain.
EBITDA and Validation
The EBITDA Calculator and Explainer computes EBITDA and adjusted EBITDA with a full reconciliation from net income, finds the depreciation and amortization wherever the chart of accounts has put it, documents each adjustment, computes the margin, and writes a plain-English explanation for whoever needs it. If there's a covenant, it tests compliance. Its caution is built in: basic EBITDA is high confidence, adjusted EBITDA is medium, because adjustments are judgments, and every external use, covenant certification, and acquisition-related calculation is flagged for human review.
The Financial Statement Validator is the tie-out prompt. Trial balance in balance, assets equal to liabilities plus equity, income statement year over year, cash flow reconciled, unusual balances detected. Its pass marks are strict: a trial balance out by more than $100 fails; a balance sheet equation out by more than $1,000 fails; a year-over-year variance above 25% gets reviewed. It's the prompt to run before any of the others, and its exceptions are findings.
Writing the Narrative
Four prompts in this group write prose, and they're cast as different people. The Financial Statement Commentary Writer is a CFO writing the board narrative: opening paragraph, revenue discussion, profitability, balance sheet and liquidity, cash flow, a forward-looking paragraph, and a risk acknowledgment. Anything with a change over 10% or $500,000 must be discussed; below 5% is omitted unless the trend matters. External-facing commentary and anything naming a customer or contract goes to review.
The Management Discussion Writer produces an MD&A in the SEC's structure: results of operations, liquidity and capital resources, critical accounting policies, risk factors, and outlook with cautionary language. The KPI Dashboard Commentary Writer explains a dashboard: each KPI classified as exceeding target above 110%, on track at 95 to 110%, at risk at 85 to 95%, or off track below 85%, with the trend and the action. And the Financial Highlights Presenter adapts the same results to an audience, with different depth and tone for a board, a town hall, an investor day, or an external partner, and a messaging tone that shifts with performance rather than pretending a bad quarter was a good one.
All seven are in the NetSuite AI Prompt Library, under Financial Statement Analysis and Reporting.
Update, September 2026
I ran the Balance Sheet Trend Analyzer from this group against one of my NetSuite test accounts, with the queries executed through Chartstone and the analysis done by Claude, and formatted the report to one of my branding guidelines. Here's what it found.
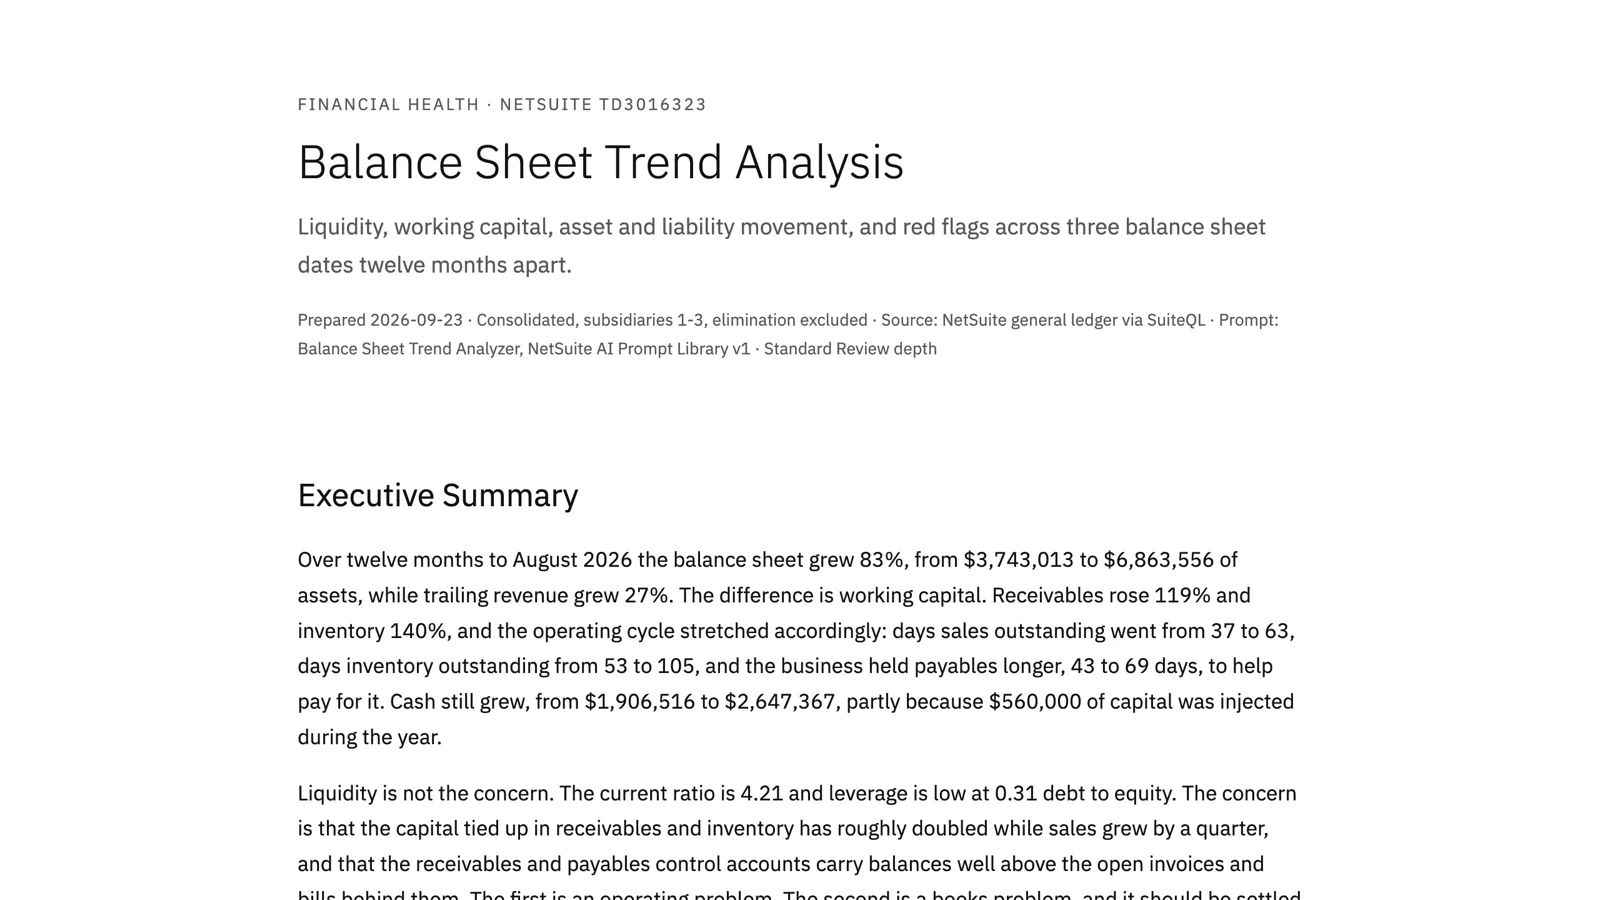
Over twelve months the balance sheet grew 83%, from $3.74 million to $6.86 million of assets, while trailing revenue grew 27%. The difference is working capital. Receivables rose 119% and inventory 140%. Days sales outstanding went from 37 to 63, days inventory outstanding from 53 to 105, and the business held its payables longer, 43 days to 69, to help pay for it. The cash conversion cycle went from 47 days to 99. Every one of its three parts moved the wrong way for cash, and cash still grew, partly because $560,000 of capital was put in during the year.
Liquidity isn't the concern, and the report said so: current ratio 4.21, debt to equity 0.31. The concern is a books problem sitting underneath the operating one. The receivables control account carries $2.11 million against $927,000 of open invoices, and payables carries $1.38 million against $181,000 of open bills. The report failed its reconciliation test on both, ranked that third among the red flags, and put reconciling the control accounts as the first action, ahead of collections and ahead of the inventory count. You can't fix a working capital problem on a balance sheet you can't reconcile.
What I'd take from it is the ordering. Three findings, all real, and the report knew which one had to come first. The prompt's rule that any unexplained material balance change goes to a person is what produced that ordering, and it's a better answer than a list of ratios.
You can read the full report here: Balance Sheet Trend Analysis. The names and numbers are test data.