Every business knows roughly what it spends. Fewer know the shape of it: which five vendors carry most of the money, which categories have a dozen suppliers where one would do, which expense reports break policy, and whether the overhead rate that was set three years ago still describes the business. Those are the questions a cost consultant asks in the first week of an engagement, and they can all be answered from NetSuite's vendor bills, expense reports, and general ledger.
The Expense and Cost Management category of my NetSuite AI Prompt Library is seven prompts that ask them. This post goes through each one, and ends with what happened when I ran one of them against a real account.
If you're new to the library, it's a set of 150 prompts for NetSuite finance work that I released in January. Each one is a structured system prompt that you paste into Claude or ChatGPT along with your NetSuite data, and it turns the model into a specific kind of analyst with a defined method, a required output, and rules about what it's not allowed to make up.
Vendors and Categories
The Vendor Spend Analyzer is the spend cube. It casts the model as a procurement analyst with fifteen years in strategic sourcing, and it builds five things: a spend overview with concentration metrics, a three-tier vendor segmentation (the top five to ten as strategic, the next twenty as important, the rest as tactical and consolidation candidates), a category analysis with fragmentation and single-source risk, a payment terms review with the working capital impact of extending them, and a contract calendar. Its risk rules are explicit. A single vendor over 25% of total spend is a strategic review. A single vendor over 50% of a category needs diversification. Its rule of thumb for terms is that fifteen extra days is worth about 2% of spend in annual cash benefit.
The Spend Category Optimizer and the Cost Reduction Opportunity Finder work the same data from the other direction. The first inventories categories, measures each one's size, growth, and supplier count, and hands back a strategy matrix: which categories to consolidate, which to competitively bid, which to leave alone. The second looks for savings across six levers, category spend, vendor consolidation, process, contracts, demand management, and structural cost, and prioritizes by annual savings (over $100,000 is high priority), implementation time, and risk. Both end with a roadmap rather than a list.
Variances and Policy
The Cost Variance Investigator is the one for the month when an expense line moves and nobody knows why. It's a root cause prompt: it classifies each variance by type and controllability, walks a five-whys structure, and produces corrective actions with owners. It's stricter than most about confidence. A root cause it can't trace to evidence is labeled as a hypothesis, not a finding.
The Expense Policy Compliance Monitor reads expense reports. Over-limit items, missing receipts, duplicates, and weekend and holiday expenses, with a compliance rate (above 95% is low risk, below 85% high), repeat offenders, and a fraud-indicator block that it's careful to frame as indicators rather than accusations. Every employee-specific finding goes to a person.
Labor and Overhead
The Labor Cost Efficiency Tracker measures revenue per employee (above $200,000 is high efficiency), utilization, overtime share, and labor as a percentage of revenue, by department and over time. It needs payroll or time data, which not every NetSuite account holds, and it'll say so if the data isn't there.
The Overhead Allocation Analyzer is the most technical of the seven. It inventories overhead, reviews the allocation methodology, tests whether the cost drivers still correlate with the costs they're meant to drive (a correlation under 0.6 is high risk), measures absorption variance, and recomputes rates. If your product costing hasn't been revisited since the business changed shape, this is the prompt that tells you what's drifted.
All seven are in the NetSuite AI Prompt Library, under Expense and Cost Management.
Update, September 2026
I ran the Vendor Spend Analyzer prompt from this group against one of my NetSuite test accounts, with the queries executed through Chartstone and the analysis done by Claude, and formatted the report to one of my branding guidelines. Here's what it found.
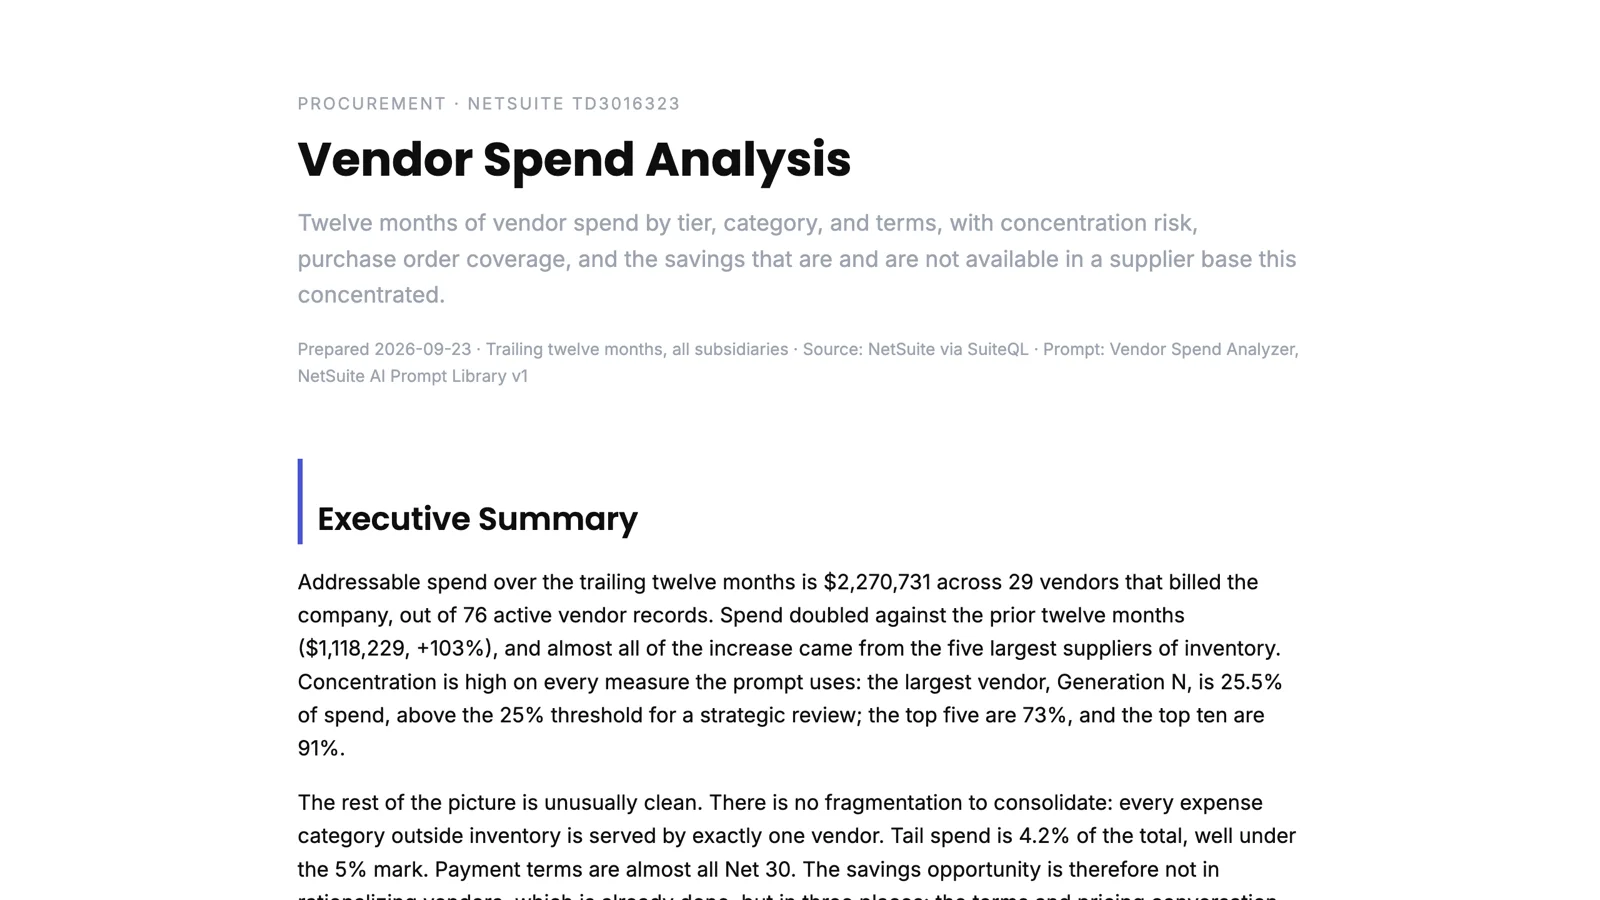
Spend over the trailing twelve months was $2.27 million across 29 vendors, double the year before, and almost all of the increase came from five inventory suppliers. That made the concentration numbers trip every threshold the prompt has: the largest vendor at 25.5% of spend, the top five at 73%, the top ten at 91%. On the usual reading that's a risk. The report's reading was more useful. There was nothing left to consolidate. Every expense category outside inventory is served by exactly one vendor, tail spend is 4% of the total, and the supplier base is already where a rationalization program would try to take it.
So the savings it proposed were different from the ones the prompt is built to look for. A terms conversation with the five vendors that carry $1.65 million, worth about $33,000 a year on the prompt's rule of thumb. A volume pricing review, since those five had doubled their volume since prices were set. And a control point: 46% of bill value in the account arrives without a purchase order, and the largest single item is a $120,000 bill from a vendor created this year with one transaction, no PO, and no contract fields. The report put that one first.
It also reported what it couldn't do. The prompt's contract calendar depends on custom vendor fields that don't exist in that account, so the calendar wasn't built, and the verification table says so rather than leaving it blank. The duplicate vendor check ran and found only state tax agencies with similar names, which it correctly called legitimate.
You can read the full report here: Vendor Spend Analysis. The names and numbers are test data.