"The sales order form is slow." Every NetSuite administrator has heard some version of it. Slow to open, slow to add a line, slow to save. And the first instinct is usually wrong. The cause is almost never the account tier or the SuiteCloud licensing. Those buy asynchronous server capacity, for scheduled scripts and map/reduce jobs. Form speed is governed by something else entirely: the synchronous, per-request work that runs while the user waits.
I've been working on a prompt that audits that work, layer by layer, and it'll be in the next release of the Sonar AI Prompt Library. I ran it against a sales order form in one of my NetSuite test accounts last week, and I want to walk through what it does and what it found.
If you're new to this, Sonar AI is an AI agent that runs inside NetSuite. Every prompt in the library is a playbook that I engineered and tested against live NetSuite data, and you run it inside your own account, against your own records.
Six Layers
There are six places where synchronous work hides on a transaction form, and each one shows up as a different symptom.
- User event scripts - every deployed script's beforeLoad runs on every open, and beforeSubmit and afterSubmit run on every save.
- Client scripts - pageInit slows the open, and fieldChanged, postSourcing, and validateLine slow every line.
- Workflows - on-create and on-view-or-update triggers, especially the ones with saved-search conditions, which are evaluated server-side every time.
- Custom fields - sourced and dependent fields mean round-trips per line.
- Form complexity - tabs, sublists, and the sheer field count on the entry form.
- Bundles - third-party bundles contribute scripts, workflows, and fields, and their beforeLoads are the single most common root cause I see in the field.
The prompt works through those layers in phases, in order, and it's read-only. It doesn't modify a record, a script, a deployment, or a setting. An audit that changes state is worse than no audit.
Evidence or Label It a Hypothesis
The rule I care about most is the evidence discipline. Every finding is tagged one of three ways: measured, meaning it's backed by data from the account, such as row counts or log volumes; observed, meaning it's an anti-pattern seen in actual source code; or hypothesis, meaning it's plausible but unconfirmed, with a note about what would confirm it.
Performance audits lose credibility the moment one claim turns out to be speculation stated as fact. So the prompt doesn't count deployments and stop. Counting is necessary, but one bad script outweighs ten clean ones. It reads the code, and it quotes the offending lines with file ids and line numbers.
Every finding also gets a severity, from critical down to informational, and an effort rating, from trivial to significant. A finding without a triage signal is trivia.
What It Found
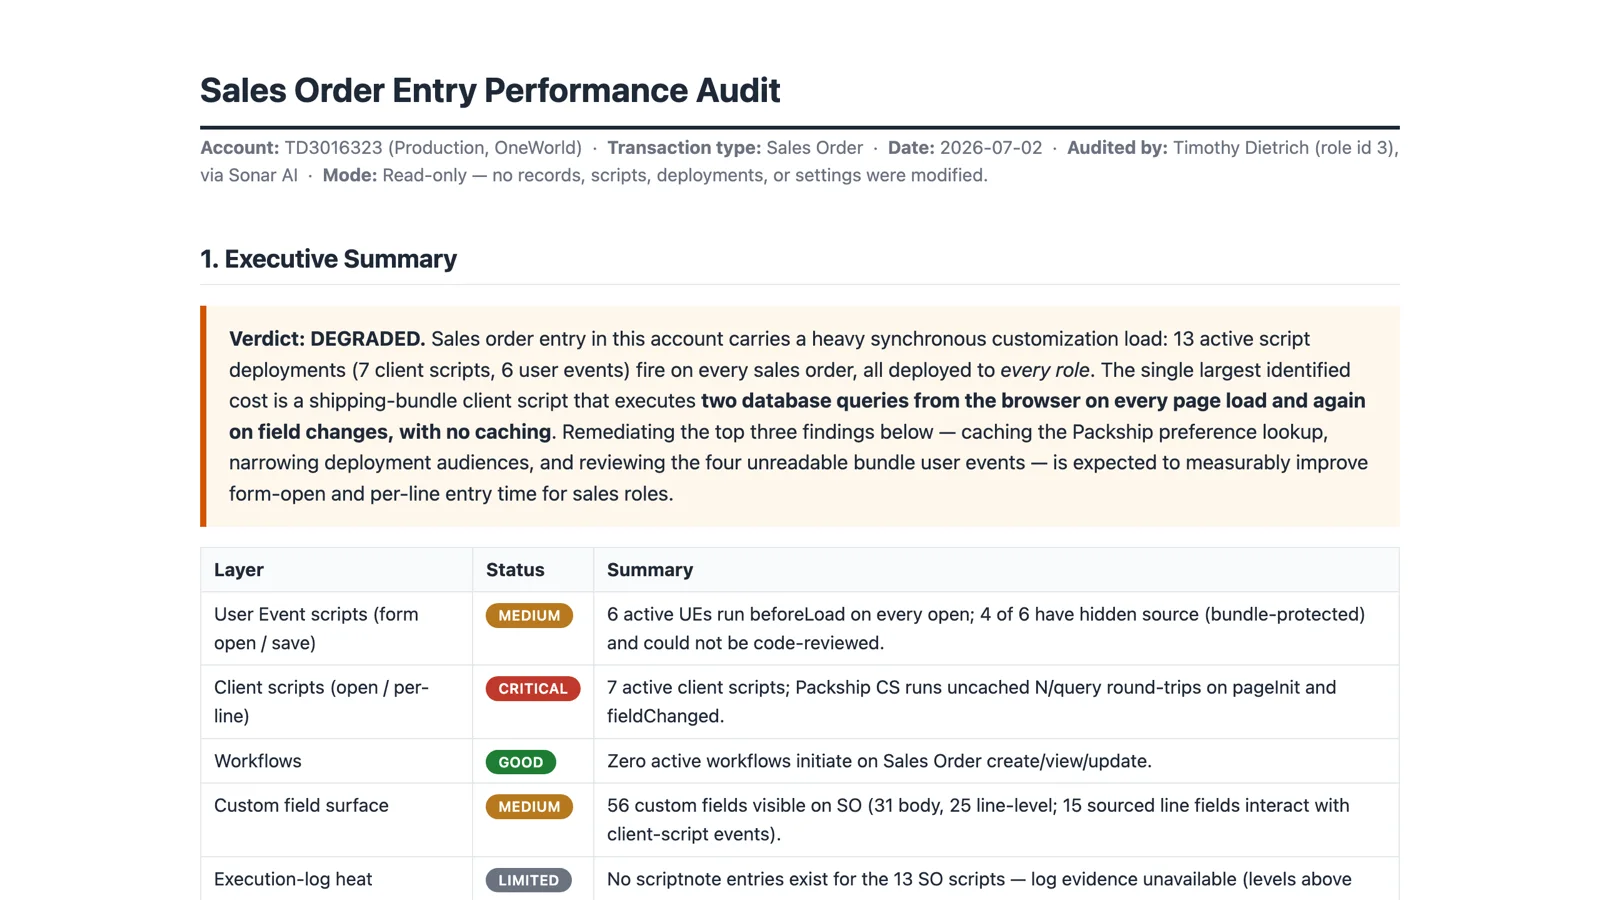
The verdict for the sales order form in my test account was "degraded." Thirteen active script deployments fire on every sales order: seven client scripts and six user events, all of them deployed to every role. Zero active workflows target the form, which was the one layer rated good.
The single largest cost was a shipping bundle's client script. Its pageInit function runs a full database query against a shipping-preference record, from the browser, synchronously, on every sales order open. The same routine runs again on every change to the ship method, subsidiary, or location, and each ship method evaluation triggers a second query. There's no caching anywhere. That finding was tagged observed, with the file id and the lines quoted, and rated critical.
Four of the six user events were bundle-protected, so their source couldn't be read. The prompt didn't pretend otherwise. They went into the concerns section as hypotheses, with a recommendation to install NetSuite's Application Performance Management SuiteApp, which is the only way to get per-script timings on hidden code.
The custom field surface was 56 fields visible on the sales order, 31 at the body level and 25 on the line, with 15 sourced line fields that interact with the client-script events. Fields alone rarely cause dramatic slowness. Thirty line-level fields with sourcing, compounding with fieldChanged handlers, is a different story, and the report describes the interaction rather than just the count.
The Remediation Plan
The plan is ordered by severity divided by effort, so the quick wins come first. In this case, the first item was an administrator's config change: narrow the deployment audiences, so the shipping script only runs for the fulfillment roles that need it. The second was escalating the uncached query to the bundle vendor. Third was instrumenting with APM, which converts the hypotheses into measurements. Then a form hygiene pass to hide unused bundle columns, a review of one custom controller, and a longer-term plan to retire the SuiteScript 1.0 scripts in one of the bundles.
You can see the full report from this run here: Sales Order Entry Performance Audit. The appendix has every query that was run, verbatim, along with the tool calls and row counts, because full reproducibility is what separates an audit from an opinion.
What It Can't See
This is static analysis, not profiling. It finds causes. It can't measure milliseconds. It also can't see client-side network latency, browser extensions, data center load, or an integration hammering the same record. The report says so, and its next-steps section tells you how to close the gap: a timed browser test with the developer tools open, three runs each for open, add a line, and save, before and after each fix. Then re-run the audit and diff the two scorecards.
The prompt works for any transaction entry form: sales orders, invoices, purchase orders, estimates, vendor bills, item fulfillments. You tell it the transaction type and whatever you already know about the symptoms. "Only the warehouse role is affected" narrows the search a lot, because it points at deployment audiences and form assignment rather than global scripts.
This prompt will be in the next release of the Sonar AI Prompt Library. I'll post here when it's out.