Until August, most of the prompts in the Sonar AI Prompt Library answered a question about the business. What's our operating leverage. Which items are negative. Where did revenue go last month. The prompt runs, the report comes back, and you have an answer.
The nine prompts in this post do something different. They read the business from the ledger first, and then they hand back a plan. A growth plan, a three-year roadmap, an operating cadence, a cost-reduction program, an operational audit. This is new territory for the library, and I want to explain how they're built and what they found in one of my NetSuite test accounts.
If you're new to this, Sonar AI is an AI agent that runs inside NetSuite. Every prompt in the library is a playbook that I engineered and tested against live NetSuite data, and you run it inside your own account, against your own records.
Learn the Business First
All nine share one design decision. Before the prompt recommends anything, it profiles the business from the data: the industry, the channels, the customers, the catalog, the margins, the headcount, the revenue trajectory. It works out what kind of company this is from the transactions, not from a description that somebody typed in.
That matters because the recommendations have to cite the numbers. A generic growth plan says "raise prices." A plan built from the ledger says which hero products are priced below cost, and by how much. The difference between those two is the difference between advice and a work list.
The other shared rule is the one that runs through the whole library. Every figure traces to a query that's printed in the report, and the assembly math is done in code rather than by the model.
The Plan
Growth Opportunity Analysis & Execution Plan is the anchor. It answers a question that I think every operator should be asking their ERP: where is the next dollar of growth cheapest? It identifies 25 opportunities across seven categories (quick wins, long-term bets, pricing, partnerships, AI automation, upsells, and new revenue streams), scores each on impact, difficulty, investment, and expected ROI, and sequences them into a 90-day, two-quarter, and eight-quarter plan with a risk register and an interactive progress checklist.
In the test account, a $17M multi-channel home and lifestyle retailer, the finding was that the business didn't have a growth problem. Revenue was compounding at about 36 percent, and a loyal core of 100 customers ordered 60 to 109 times each. It had a monetization problem. Hero products were priced below cost, delivery was being given away, services and warranties were unlaunched, and 165 of 324 CRM records had never bought anything. Gross margin sat at 31.5 percent against a 45 to 55 percent benchmark for the category. Fixing pricing and attach-rate economics was estimated at $700K to $1.4M of annual profit before a single new customer is acquired, and that funds every longer-term bet on the list.
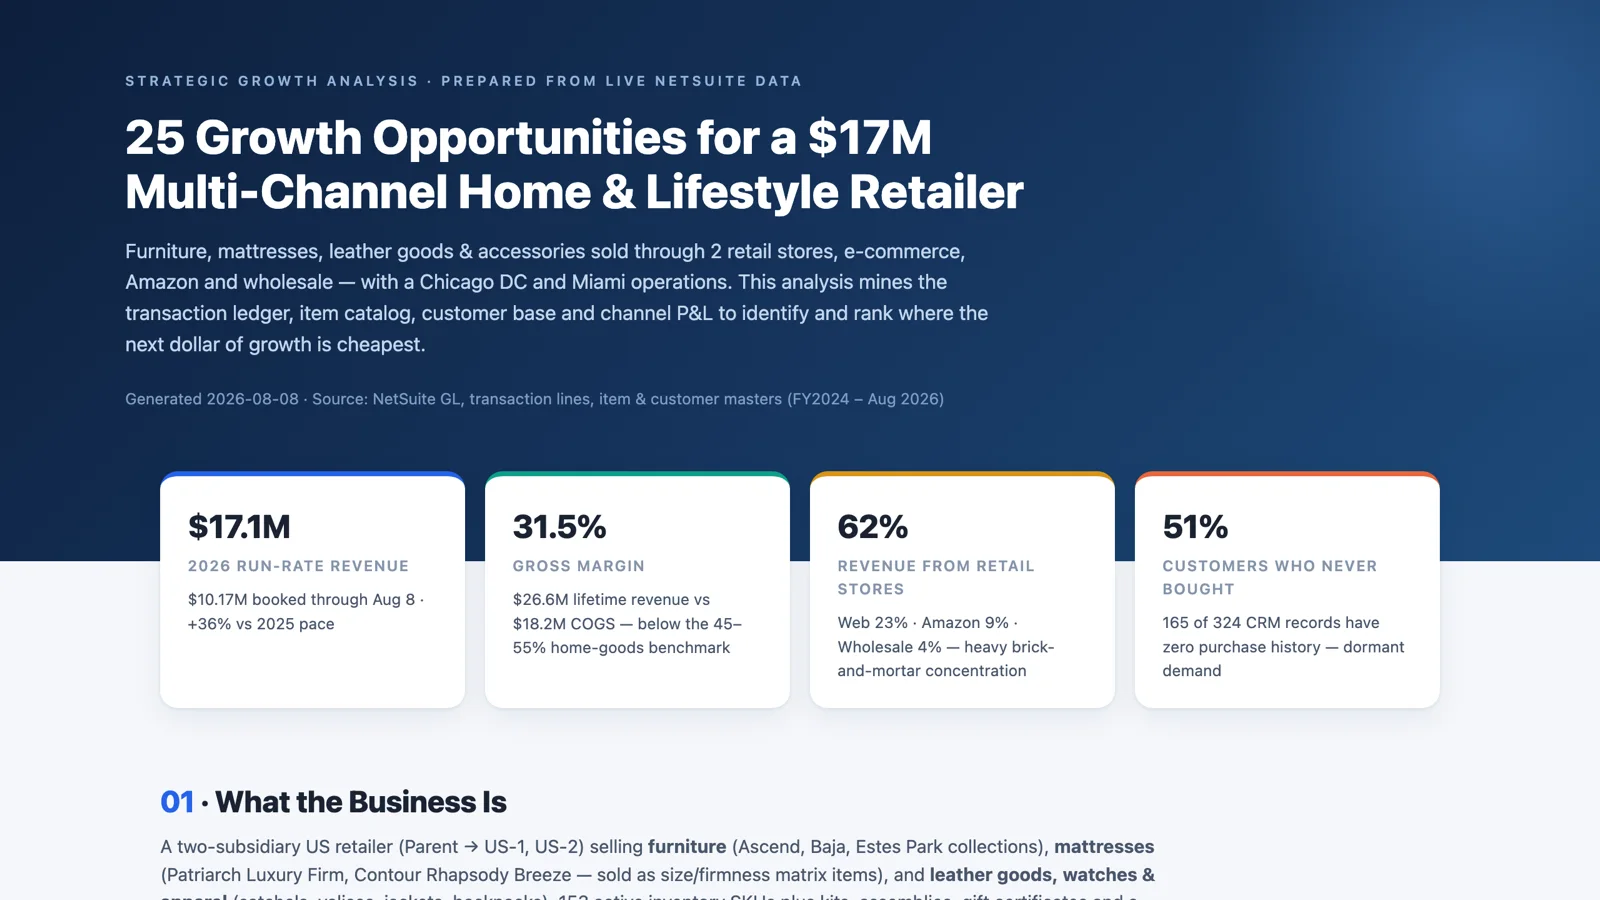
Sample reports: Growth Opportunity Analysis (the retailer), and an earlier run of the same prompt against a multinational manufacturing group, where a per-subsidiary P&L changed the margin story and a $9.8M intercompany transfer had to be stripped out before the real growth curve was visible.
Revenue Expansion Roadmap is narrower and, in a way, more interesting. It designs new income streams (pricing, upsells, subscriptions, memberships, premium services, recurring revenue) and sequences them by business maturity and customer trust, so the plan doesn't ask a company to sell subscriptions to customers who've bought once. In the test account it found that 63 percent of revenue came from 51 loyal buyers with 16 or more orders each, that 11 accounts were already ordering monthly and represented an $82K a month contract-ready recurring pool, and that $764K of service revenue was already proven through delivery attach. That's the raw material for a recurring model, and the report lays out the launch timeline for it. It also includes a reconciliation of GL revenue by transaction type, because intercompany flows inflate the baseline if you let them.
Sample report: Revenue Expansion Roadmap.
3-Year Business Scaling Roadmap takes the long view: revenue milestones, a staged hiring plan, systems and automation sequencing, marketing expansion, product bets, and twelve quarters of goals. For the retailer, it charted the path from a $15.5M run-rate to $35M or more by fiscal 2029, and it named the lever plainly. Gross margin had been flat at 31.5 percent for two years, 78 percent of direct revenue depended on two physical stores and one marketplace, and only 10 of 39 employees were mapped to a department.
Sample report: 3-Year Scaling Roadmap.
The Operating Cadence
AI COO: Business Diagnosis & Operating System is the most ambitious prompt in the library. It acts as a chief operating officer: it diagnoses the weaknesses with evidence, and then it delivers a department-by-department operating system covering marketing, sales, finance, support, operations, hiring, reporting, automation, a weekly review ritual, a risk register, and a 90-day action plan.
The diagnosis in the test account was one sentence long: a healthy, growing consumer-products business with a strong balance sheet, being quietly undermined by four broken back-office processes. Revenue had climbed eight consecutive quarters to $1.36M a month, with positive operating income and two months of revenue in cash. Meanwhile, 59 percent of overdue receivables were aging past 60 days, 20 support cases sat escalated with an average age of 91 days, and not one of the 36 quotes issued since July had converted to an order. The growth engine worked. The constraint was operational discipline.
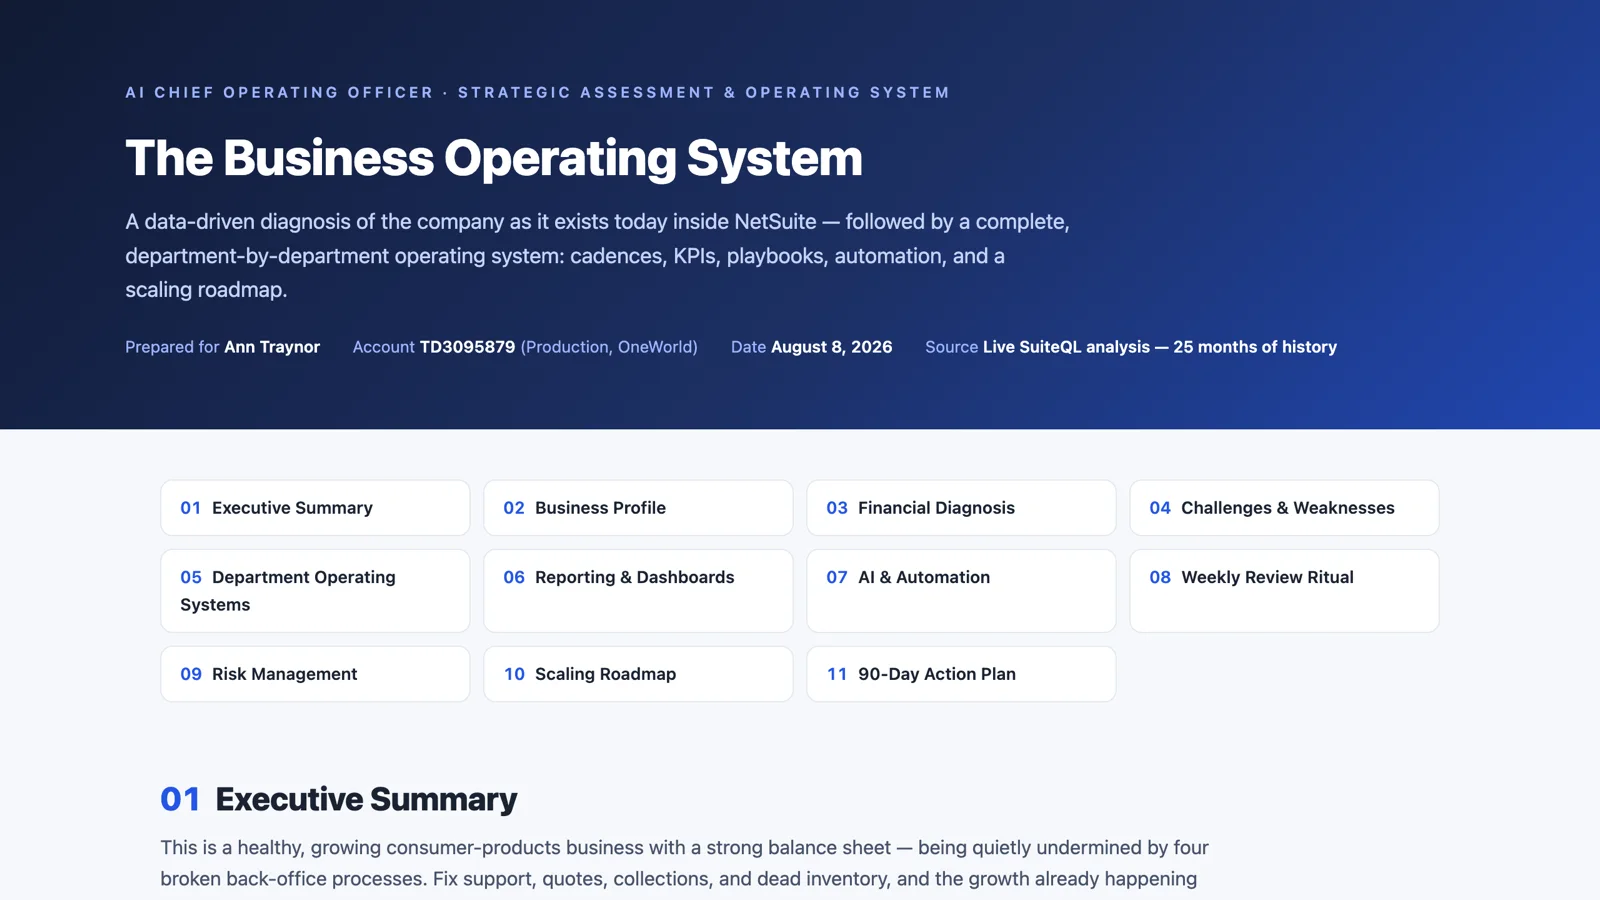
Sample report: AI COO: Business Operating System.
Operational Scaling Readiness Assessment asks the question that every growing company eventually asks, usually too late: if order volume doubles, which processes scale and which break first? It tests nine core processes against a two-times horizon and sorts each into one of four categories: scales as-is, survives only by adding headcount, needs exception-based redesign, or fails outright, and at roughly what volume. Each process gets an early-warning metric, the leadership decision that's blocking the fix, and the most practical remedy.
The uncomfortable headline in the test account was that doubling wasn't a future-state exercise. Sales orders had run about 35 a month for a year, then jumped to 244, 237, and 467. The business was four months into a thirteen-times ramp. Overdue invoices were an average of 217 days late, inventory adjustments outnumbered cycle counts 43 to 1, and 16 of 145 work orders had been closed. The recurring insight, which I've seen in real engagements too, is that most "breaks at scale" problems aren't volume problems. They're missing-standard problems that volume exposes. In this run, seven one-meeting decisions replaced roughly four hires.
Sample report: Scaling Readiness Briefing.
The Cost Side
Cost Structure X-Ray answers "where does our money go" by deconstructing the fiscal-year cost base into cost centers (labor, procurement, technology, overhead) with prior-year variance, monthly anomaly forensics, vendor concentration, and a quantified top-five optimization roadmap. In the test account, revenue had grown 65 percent while costs grew 40 percent, a 12.8-point improvement in cost per revenue dollar. But the aggregate hid three things: overhead had more than doubled, a one-time July rent event of about $142K had distorted the facilities line, and 97 percent of costs posted with no department attribution. The quantified opportunity was $170K to $310K a year.
Sample report: FY 2026 Cost Structure Analysis.
Cost Reduction Scenario Modeler goes a step further and asks what a cost reduction program would be worth. It mines the ledger for evidence (vendor concentration, contract escalators hiding in monthly billing patterns, sole-source arrangements, invoices that slipped past approval gates), builds an initiative portfolio where every savings number traces to a named vendor and a specific account, and then models three fiscal years across six scenarios, a tornado sensitivity, and a 10,000-trial Monte Carlo simulation that includes an operational-disruption case.
The scan of the test account found an advertising contract whose monthly fee had escalated 14 percent in twenty months, a telecom relationship billing $135K against four overlapping expense accounts, a sole-source IT hardware arrangement, and a single $52,550 consulting invoice that tripled the August training expense. Nine initiatives added up to a $490K annual run-rate saving and $1.21M of cumulative net income over three years. The Monte Carlo put the probability of net benefit at 65 percent, and the downside case, a disruptive rollout, at minus $193K. I like that the report says that out loud. Execution quality, not the savings math, decides the outcome.
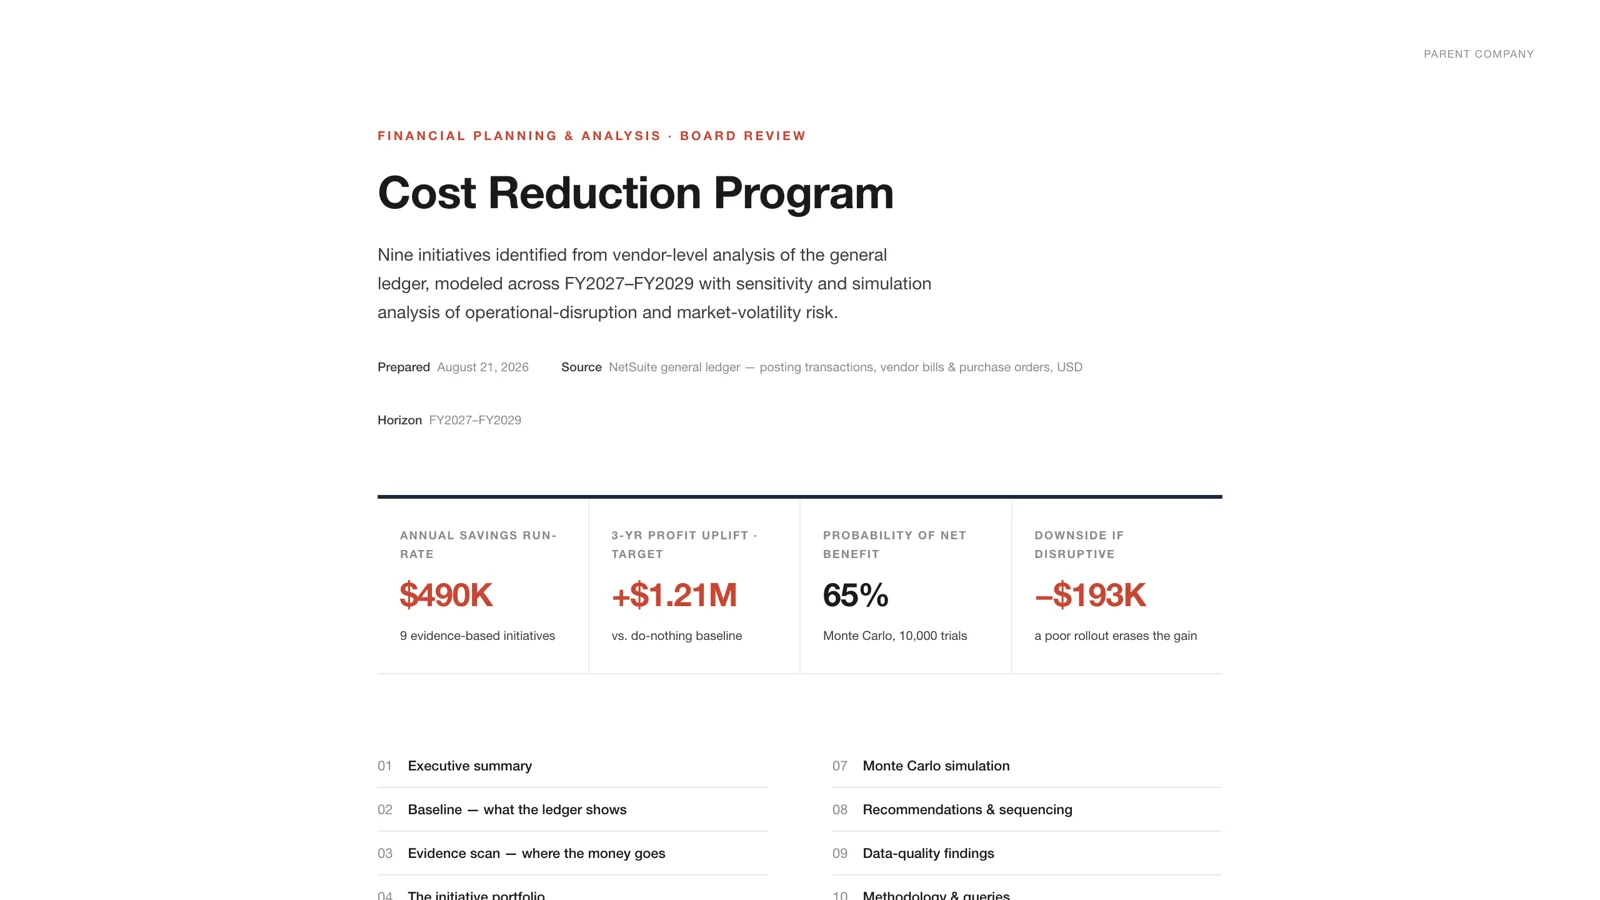
Sample report: Cost Reduction Program: Evidence, Scenarios & Risk.
The Audit
Operational Audit Command Center is the kind of operational audit that a Big 4 firm would run: financial statements, order-to-cash and procure-to-pay cycle times, inventory health, GL forensics, and a controls matrix, delivered with severity-ranked findings, a quantified 90-day action plan, and an appendix containing every query. The question it answers is "can I trust these books, and where is cash leaking?"
In the test account, day-to-day operations worked well. Financial governance did not. 84 percent of reported revenue had been posted by journal entry rather than customer transactions, no accounting period had been closed since November 2021, $228K of collected sales tax across 12 states sat unremitted, and the GL carried about $1.0M more inventory than the item ledger did. Until the ledger was re-baselined, the statements couldn't support lending, audit, or diligence. The fixes were largely procedural, and the 90-day program was self-funding: roughly $390K to $600K identified against about $30K of external spend.
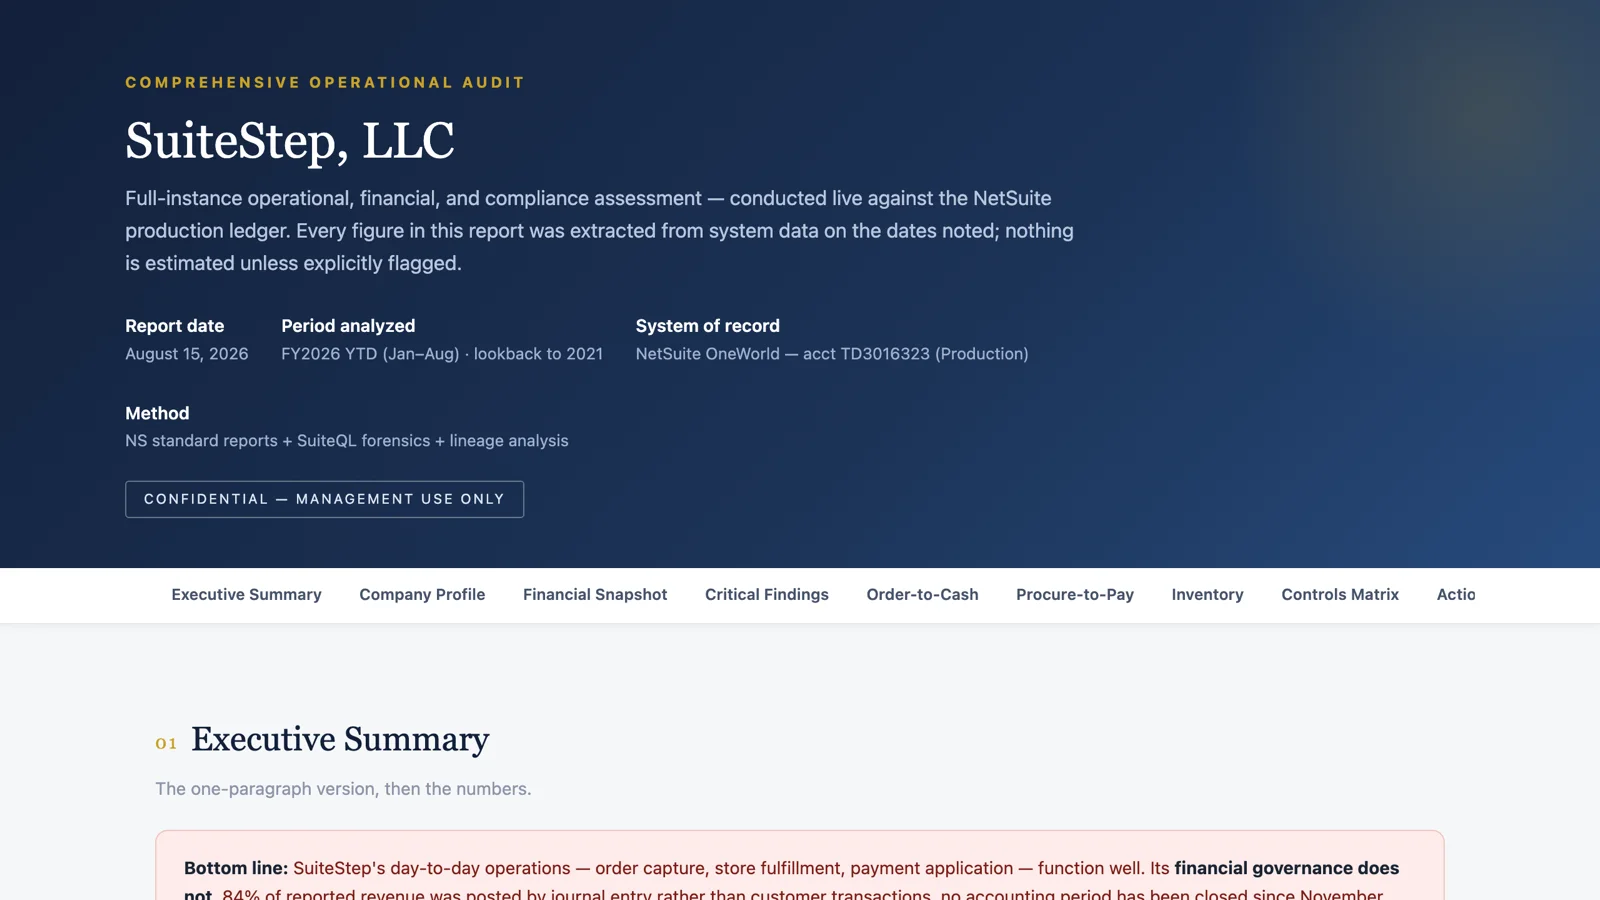
Sample report: Comprehensive Operational Audit.
Operational Benchmark Gap Analysis answers "how do we compare to our industry" for three metrics that decide working capital: days sales outstanding, inventory turns, and close duration. It fetches current benchmarks live from the web, flags every source it couldn't verify, computes the same three metrics from the ledger on a defensible basis, and then drills into each gap to say whether it's structural or fixable.
That last part is the point. In the test account, DSO came in at 175 days against a benchmark of about 25, seven times the industry figure. The drill-down overturned the headline: customers who paid, paid on receipt, with a median of zero days. The balance was a stagnant tail of 17 aged invoices making up 69 percent of open receivables. That's a collections-hygiene problem, fixable in a quarter, not a pricing-and-terms problem that takes a year. Inventory turns were 4.9, within the 4 to 6 range for the category. And close duration couldn't be benchmarked at all, because no period had ever been closed.
Sample report: Operational Benchmark Review.
Wrapping Up
I was skeptical about this tier when I started building it. Strategy prompts are where AI is most tempted to produce confident generalities, and I didn't want the library to carry any of those. What changed my mind was the discipline of starting from the ledger. When the plan has to cite the invoice, the SKU, and the account, the generalities fall away, and what's left reads like something a good consultant would have found after a few weeks on site.
None of these prompts replaces the judgment of the people running the business. They give those people a plan to argue with, backed by their own numbers, on the same day they ask for it.
All nine are in the paid tier of the Sonar AI Prompt Library. Look for Growth Opportunity Analysis & Execution Plan, Revenue Expansion Roadmap, 3-Year Business Scaling Roadmap, AI COO, Operational Scaling Readiness Assessment, Cost Structure X-Ray, Cost Reduction Scenario Modeler, Operational Audit Command Center, and Operational Benchmark Gap Analysis. The release they came in is covered in 54 New Prompts Added to the Sonar AI Prompt Library.