Every multi-location shipper eventually asks the same question: where do orders actually wait? Not the average days to ship, which hides everything, but the stage where the time goes, the location where it goes, and the kind of order that goes there. No standard NetSuite report answers it.
I've been working on a prompt that does, and it'll be in the next release of the Sonar AI Prompt Library. It reconstructs the fulfillment pipeline stage by stage, order placed to pick released to packed to shipped, measures the dwell at each stage, segments the latency by location, item, and order size, finds the fulfillments frozen mid-pipeline, and values the backlog of orders that never entered the pipeline at all.
If you're new to this, Sonar AI is an AI agent that runs inside NetSuite. Every prompt in the library is a playbook that I engineered and tested against live NetSuite data, and you run it inside your own account, against your own records.
Measuring the Pipeline
Most of the prompt's hard rules are about measuring honestly, because the data makes it easy not to. The order-to-pick lag is measured through the fulfillment line's created-from link back to the sales order, because the next-transaction link that you'd expect to use frequently returns nothing for fulfillments on real accounts. Latency math uses the created date, not the transaction date, because the transaction date is editable and on imported data it's routinely wrong. Location is read from the lines, not the header, because the header's location isn't exposed to SuiteQL.
The stage is the fulfillment's status: picked, packed, or shipped. There's no timestamp for each transition unless the account keeps a system-note audit trail on fulfillments, and most don't. When it's missing, the prompt represents the picked and packed stages as current stage plus dwell age and discloses the limitation in the methodology note. It never fabricates stage timings.
And lines with no location aren't dropped. They're a segment, reported on their own, because in my experience the orders nobody owns are the ones that wait the longest.
The Queue Nobody Measures
A latency profile that only looks at fulfillments misses the orders that wait forever. So the prompt also finds every open sales order with no fulfillment line pointing at it, values those orders, and buckets them by age. That pre-pick backlog is usually the largest hidden queue in the account.
Money makes it actionable. For every delayed fulfillment, the prompt computes dollar-days, the order value times the days it waited, and sums them. An average wait tells you very little. Dollar-days tell you what the waiting costs in cash conversion and in promise dates.
What It Found
I ran it against one of my NetSuite test accounts, a multi-location distribution setup: 240 item fulfillments and 111 open sales orders that had never been fulfilled.
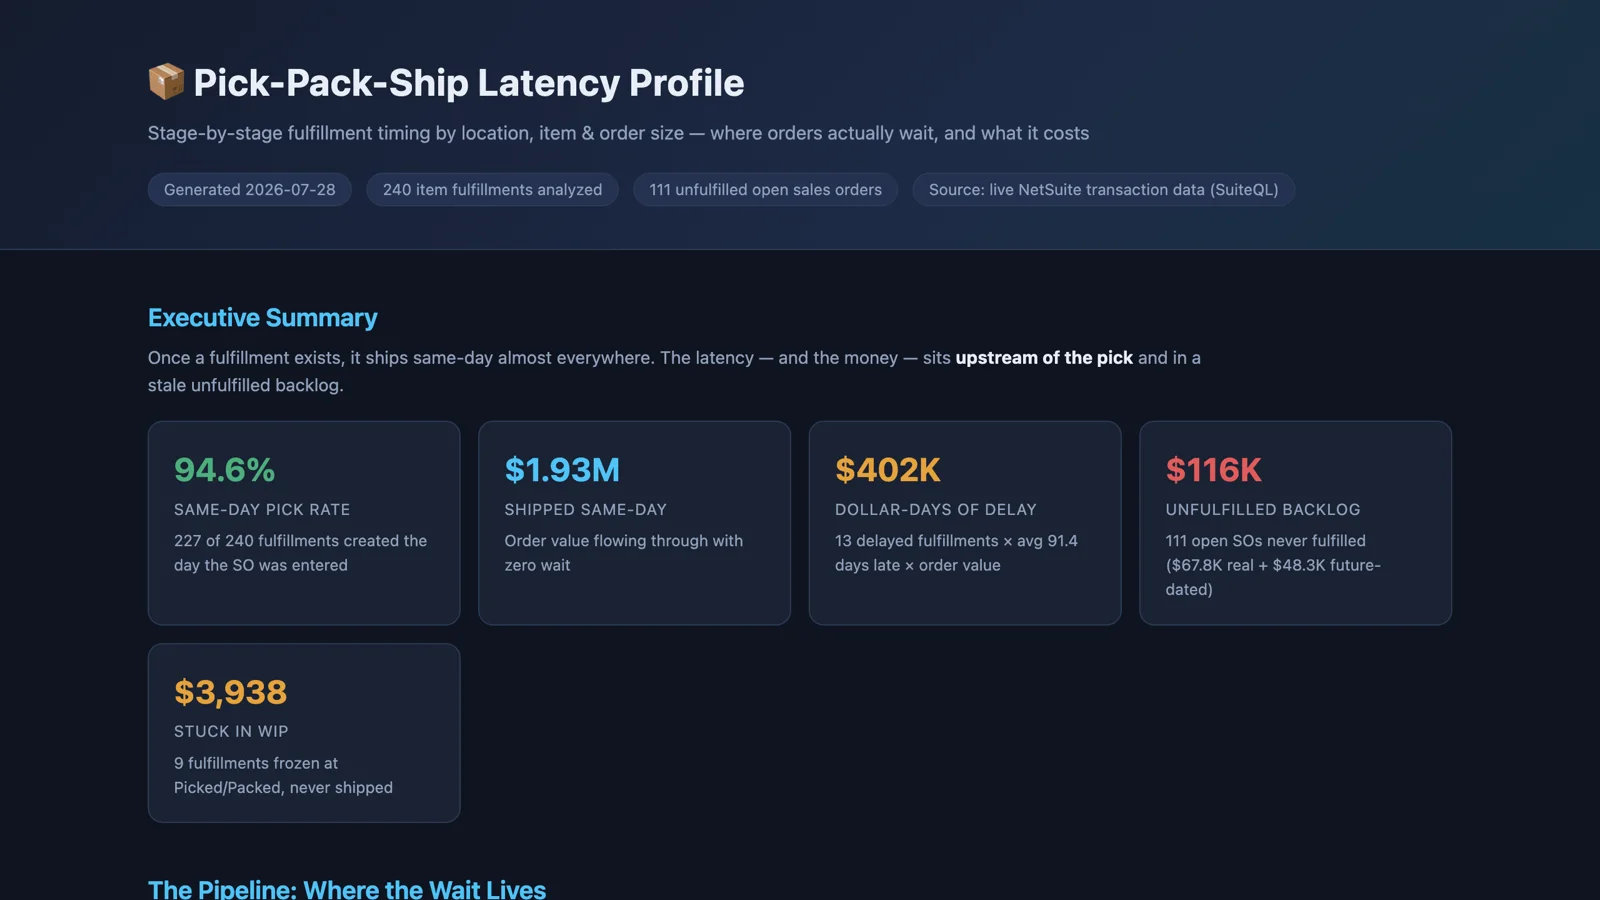
The headline was that once a fulfillment exists, it ships the same day almost everywhere. 227 of the 240 were created the day the order was entered, and $1.93M of order value flowed through with zero wait. The latency, and the money, sat upstream of the pick and in the stale backlog. Thirteen delayed fulfillments averaged 91.4 days late, which came to $402K in dollar-days. The unfulfilled backlog was worth $116K, though $48K of that was future-dated demo data that the prompt flagged and set aside. Nine fulfillments were stuck at picked or packed, with $3,938 of inventory committed and invisible to available-to-promise.
The segments told the story. New York shipped 105 of 105 orders the same day. Miami averaged 26.6 days from order to pick and had the only live stuck shipment, packed 28 days earlier and sitting. Lines with no location assigned averaged 33 days, the slowest cohort of all. Small orders of one to three lines averaged 12.4 days while large orders averaged 0.1, and every long-latency incident in the account was a small order. And the waits concentrated in soft goods and specialty items while the high-volume electronics catalog shipped at zero days, which is a backorder pattern, not a warehouse labor problem.
The stuck fulfillments split cleanly into one live shipment to chase and eight stale records from 900 to 1,642 days old to clean up. The prompt gives each row a disposition rather than a single number.
The Report
The deliverable is a self-contained HTML operations report. It opens with the executive summary and the pipeline, with the stage where the wait lives marked. Then latency by location, by order size, and by item, the financial impact, the backlog by age with the recoverable money called out, and the stuck fulfillments with a disposition per row. It closes with a prioritized action plan: what to ship now, what to triage this week, what to close next week, the root cause to fix, and the thing to measure going forward.
You can see the report from this run here: Pick-Pack-Ship Latency Profile.
The prompt is read-only. No status pushes, no order closures. It recommends dispositions, and a person executes them.
Who It's For
Wholesale distribution, retail, and e-commerce operators shipping from more than one location, and anyone who's been told that fulfillment is fine because the average looks fine. The average was fine in this account too. The money was in the tail.
This prompt will be in the next release of the Sonar AI Prompt Library. I'll post here when it's out.