How does your business stack up against your industry on margins, inventory turns, days sales outstanding, and cash conversion? A lot of finance teams can answer that once a year, when somebody builds the comparison by hand. Then the spreadsheet goes stale, and the next time the question comes up, the work starts over. Nobody remembers what last time's report recommended, or whether anyone did it.
A prompt I added to the Sonar AI Prompt Library last month is built around that gap. The benchmarking is the visible part. The part I care about is that it's a series. Every edition remembers the one before it.
If you're new to this, Sonar AI is an AI agent that runs inside NetSuite. Every prompt in the library is a playbook that I engineered and tested against live NetSuite data, and you run it inside your own account, against your own records.
Narrative Memory
On the first run, the prompt establishes a baseline and writes a machine-readable metric history to the NetSuite file cabinet. Every edition after that reads the file, computes the deltas against the last edition's snapshots, and appends its own block: the ratios, the monthly margins, the findings, and the disposition of every recommendation that's still open.
Findings get stable identifiers, so a later edition can say "dispersion widened, see finding two of edition one" and mean something specific. Recommendation dispositions are mandatory in every edition after the first. Open, resolved, worsening, elevated, with the evidence from this edition beside each one. The report's methodology section names the history file and its id, so the chain is auditable rather than regenerated from scratch each month.
The workflow is one prompt each month: run the next edition. That's the whole thing.
Rendered Statements as Ground Truth
The financials come from NetSuite's own rendered reports, not from hand-rolled SQL, and every report run is verified by reading its rendered header, so the prompt knows which periods it actually got. The ratio basis is declared and held constant across editions. Benchmarks are labeled approximate, always, because published sector composites are directional and pretending otherwise would undermine everything else.
And the prompt interrogates margin quality before celebrating it. A gross margin that jumps is a question, not a result, until the cost-of-sales accounts have been read.
What Edition One Found
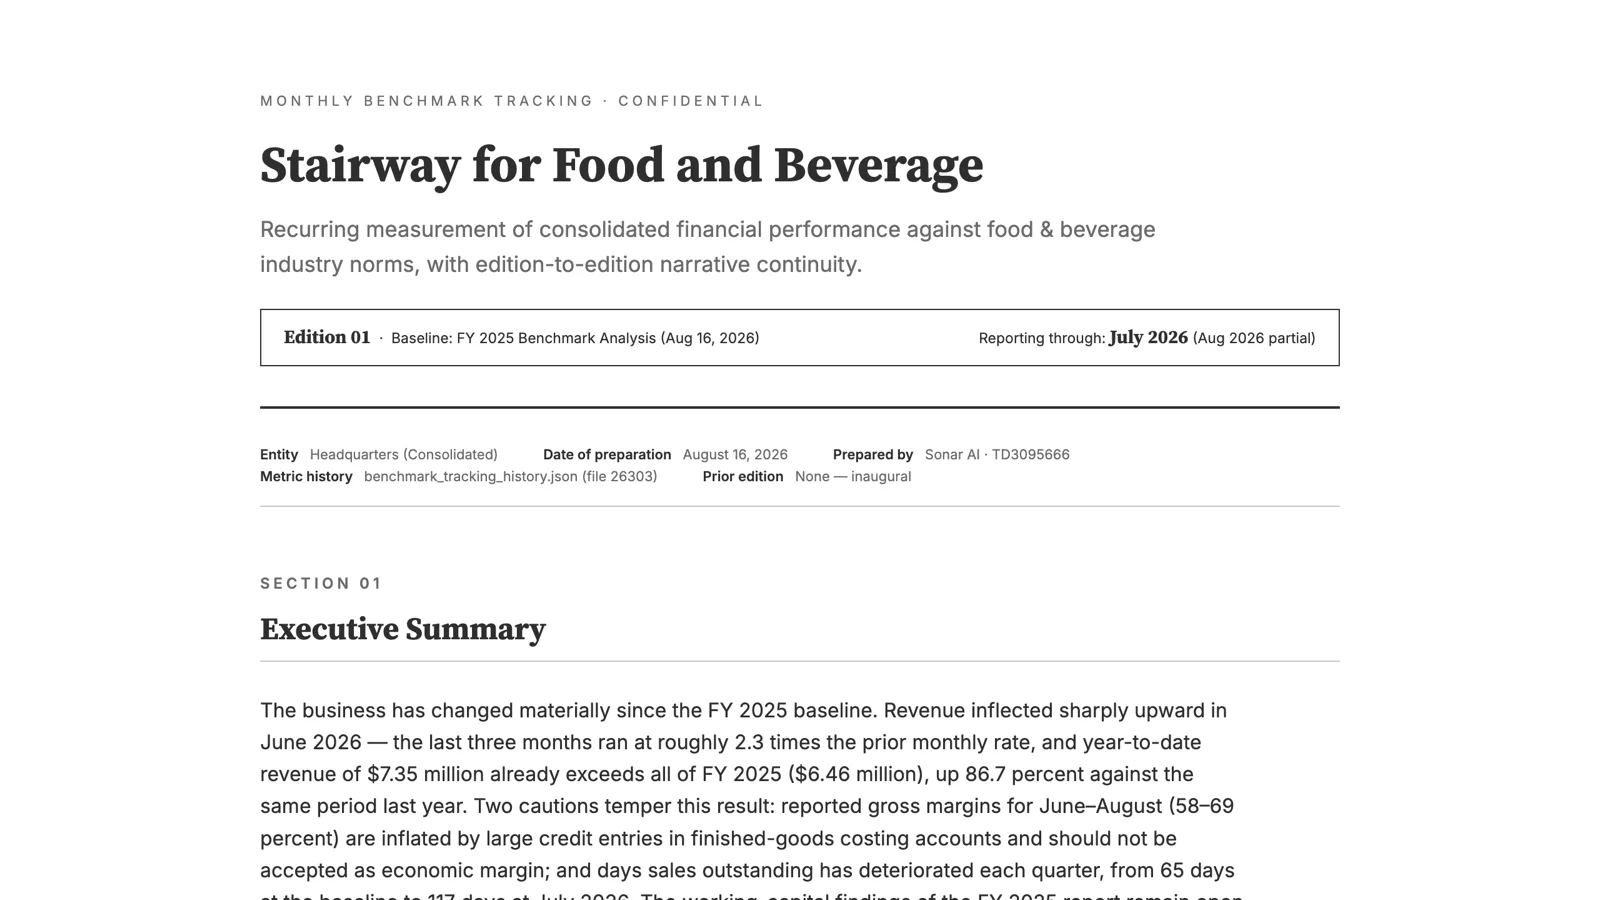
I ran the baseline against one of my NetSuite test accounts, a food and beverage business, and this is the first tracking edition on top of it. The business had changed materially. Revenue had inflected sharply upward in June, with the last three months running at roughly 2.3 times the prior monthly rate, and year-to-date revenue of $7.35M already exceeded all of the prior fiscal year. Growth of that size and abruptness usually reflects a discrete event rather than organic drift, and the report says that identifying the driver is the priority question, because the answer determines which peer set the business should be benchmarked against going forward.
Then the margin check fired. Reported gross margin for June through August ran from 58 to 69 percent, which isn't credible for a food business. The cost-of-sales section for those months carried large credit balances, more than $225K in a finished-goods account, which mechanically inflated the margin. Adjusting for those credits alone, the report put the real figure in the mid-forties, still above the prior year's baseline, but it declined to treat any 2026 margin as decision-grade until the costing had been reviewed. The prior edition's margin-dispersion recommendation was marked elevated, not resolved.
Working capital got three lenses, and they disagreed in an instructive way. The cash conversion cycle appeared to improve modestly, from 132 days to 118. But that was achieved entirely by stretching payables from 90 days to 165. The operating assets themselves had worsened: days sales outstanding had lengthened every quarter, from 65 at the baseline to 117, and inventory days were up too. A headline metric that's flattered by vendor financing is exactly what a single-lens report would miss.
The recommendations section shows the series doing its job. Three items carried forward from the baseline, all marked open and worsening, each with this edition's evidence beside it. Three new ones, numbered to continue the sequence. One of them puts the receivables problem in dollars: at the new run-rate, each day of days sales outstanding is worth about $45K of cash, so the 52-day deterioration since the baseline is roughly $2.3M of working capital.
The Report
The deliverable is an institutional-grade HTML document, in a measured voice, with a benchmark scorecard that shows each ratio as a marker on its industry band, a working-capital trend table across quarterly snapshots, the prior-edition recommendation status, and a methodology section that lists every report id and filter used. It's the kind of document a CFO can hand to a lender or an audit committee.
You can see the full report from this run here: Benchmark Tracking, Edition 01.
Who It's For
Product companies where working capital is the battleground: food and beverage, manufacturing, distribution, wholesale, consumer packaged goods, and retail. And any mid-market finance team that wants industry context around the monthly close, not just internal variances.
It's in the paid tier of the Sonar AI Prompt Library now, under "Financial Benchmark Analysis & Tracking Series."