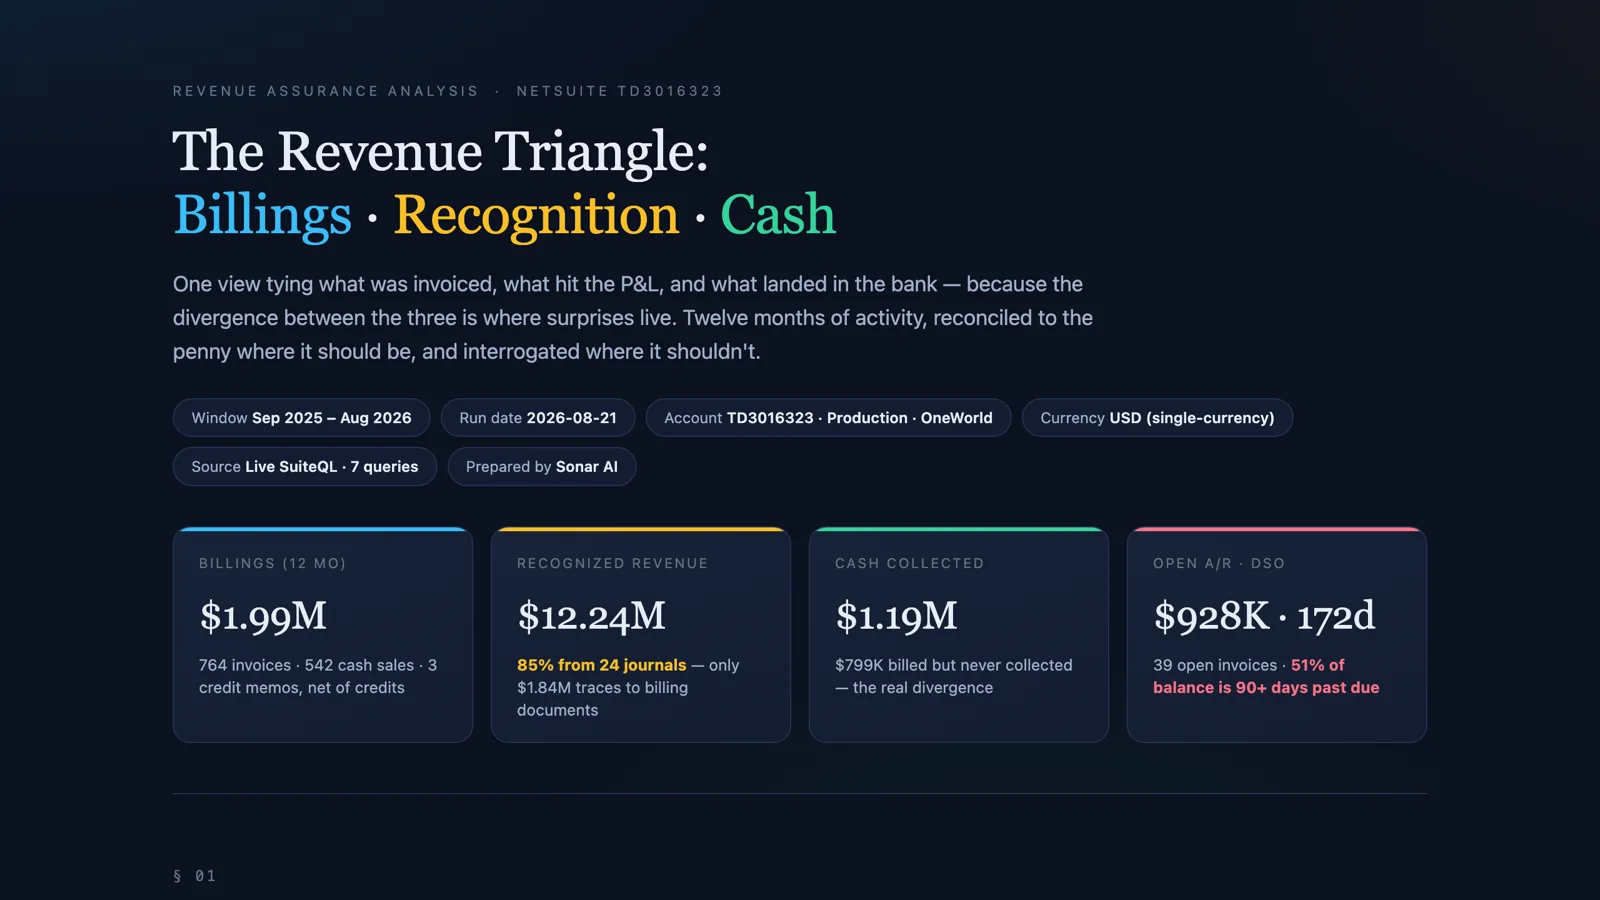
Revenue surprises rarely show up in a single report. They hide in the gaps between reports. The P&L can look healthy while cash quietly runs short. Billings can boom while recognition lags. A series of top-side journals can add millions to recognized revenue with no invoice and no deposit behind it, and nobody notices, because nobody puts the three numbers side by side.
That's the idea behind a prompt that I added to the Sonar AI Prompt Library this week. It's called the Billings, Recognition, Cash Triangle, and it does one thing: it builds that side-by-side view from live NetSuite data, computes the gaps between the three legs, and then proves which gaps are real and which are artifacts.
If you're new to this, Sonar AI is an AI agent that runs inside NetSuite. Every prompt in the library is a playbook that I engineered and tested against live NetSuite data, and you run it inside your own account, against your own records.
Three Legs
The triangle is only as trustworthy as the definition of its legs, so the prompt states them up front and repeats them in the report.
- Billings - the total of invoices and cash sales, net of credit memos, by transaction date. This includes tax and shipping, because it's what the customer owes, not what the P&L recognizes. That creates a small structural difference against GL income, and the report discloses it as expected rather than anomalous.
- Recognized revenue - GL postings to income accounts, by posting period.
- Cash collections - customer payments, deposits, and cash sales, by the date the money landed.
Credit memos and refunds keep their signs. Elimination subsidiaries are excluded. One date convention is used for all three legs and stated in the report. None of this is clever, but every one of these choices is a place where a quick analysis goes wrong quietly.
The Integrity Test
The part of the prompt that I think matters most is what it calls the integrity test. Every recognized dollar is attributed to the type of transaction that posted it. Invoices and cash sales are one bucket. Journal entries are another.
That split answers a question that the P&L can't: how much of the revenue on the income statement is backed by a billing document? When journals dominate, the recognition leg of the triangle is telling you about the books, not the business.
The second rule is that every flow gap needs a balance-sheet corroboration. If the business billed more than it collected over twelve months, that difference should show up as open receivables today. If it doesn't, the analysis is wrong somewhere, and the prompt says so rather than reporting the gap.
What It Found
I ran it against one of my NetSuite test accounts, a OneWorld retail and wholesale setup with an elimination subsidiary and a mix of invoices and point-of-sale cash sales. Three legs, two stories.
The recognition leg looked alarming at first. GL revenue ran about six times billings. But the integrity test showed that it was cosmetic: $10.4M of the $12.2M recognized came from monthly "beginning balance" seed journals with no billing or cash counterpart. Strip those out, and billings and recognition reconcile within normal timing noise.
The cash leg was the opposite: unglamorous, and genuine. Over twelve months the business invoiced $799K more than it collected. That gap matched the past-due receivables balance to within 0.07%, and half of the open balance had been overdue for more than 90 days. Collections capacity was flat, somewhere between $73K and $117K a month, no matter how much was billed. Heavy invoice months simply piled onto the backlog.
And the cash-sale channel converged perfectly, which is what you'd expect when billing and payment are the same event. The prompt treats that as a built-in control group and names it in the report, because a healthy leg is a finding too. It tells you the method is sound.
The Report
The deliverable is a self-contained HTML report. The centerpiece is a monthly chart with a toggle between total GL revenue and revenue traceable to billing documents. When journals dominate, flipping that toggle is the headline finding. Around it are the executive summary, the findings classified as cosmetic or operational, an aging donut, the top open balances, the data integrity checks, and an appendix with every query that produced a number. There's also a CSV with one row per month, so the analysis can be reproduced.
You can see the full report from this run here: Billings, Recognition, Cash: The Revenue Triangle.
The prompt is read-only. It analyzes and it doesn't fix. Remediation, such as tagging the journals or building a collections drill-down, is offered as a follow-up after the report is delivered, and it's your call.
Who It's For
Any business that invoices on terms. Wholesale distribution, manufacturing, professional services, SaaS, and mixed operations that have both invoices and point-of-sale. That's where the gaps between the three legs open up, and that's where the surprises live.
The prompt came out of a real engagement, where both of the failure modes above turned up in the same account: a cosmetic divergence that looked like a crisis, and a real collections gap that nobody had quantified. I built the prompt so that the next account gets both answers in one pass.
It's in the paid tier of the Sonar AI Prompt Library now, under "Billings, Recognition, Cash Triangle."