Most of the NetSuite integration projects that I work on involve product, sales, and purchasing data. However, I recently started working on a project for one of my clients - a large asset management firm - that required me to work with a few tables that involve the financial side of NetSuite, such as TransactionAccountingLine, AccountingPeriod, and so on.
The goal of the project is to develop a custom portal that will provide summarized financial information to the firm's management team and their private investors. Some of the reports that it provides are Income Statements, Balance Sheets, and other standard financial reports. In addition, some of this information is presented as charts.
Comparative Income Statements
One of the reports that the portal provides is a Comparative Income Statement. A Comparative Income Statement includes data for multiple periods, with each period's data presented in its own column. Think of it as a series of Income Statements presented side by side. This makes it easy to analyze the data from the various periods.
This is one of the more challenging reports that I've worked on. The SQL query that was needed for the summarized report looked something like this.
SELECT
	AccountingPeriod.PeriodName,
	AccountingPeriod.StartDate,
	Account.AcctType,
	SUM( COALESCE( TransactionAccountingLine.Credit, 0 ) - COALESCE( TransactionAccountingLine.Debit, 0 ) ) AS Balance
FROM
	Transaction
	INNER JOIN TransactionAccountingLine ON ( TransactionAccountingLine.Transaction = Transaction.ID )
	INNER JOIN Account ON ( Account.ID = TransactionAccountingLine.Account )
	INNER JOIN AccountingPeriod ON ( AccountingPeriod.ID = Transaction.PostingPeriod )
WHERE
	( Transaction.TranDate BETWEEN TO_DATE( '2020-04-01', 'YYYY-MM-DD' ) AND TO_DATE( '2020-06-07', 'YYYY-MM-DD' ) )
	AND ( Transaction.Posting = 'T' )
	AND ( Account.AcctType IN ( 'Income', 'COGS', 'Expense', 'OthIncome' ) )
GROUP BY
	AccountingPeriod.PeriodName,
	AccountingPeriod.StartDate,
	Account.AcctType
ORDER BY
	CASE
		WHEN Account.AcctType = 'Income' THEN 1
		WHEN Account.AcctType = 'OthIncome' THEN 2
		WHEN Account.AcctType = 'COGS' THEN 3
		WHEN Account.AcctType = 'Expense' THEN 4
		ELSE 9
		END ASC,
	AccountingPeriod.StartDate ASC
The portal is retrieving this data from NetSuite using SuiteTalk REST Web Services and SuiteQL queries. A response looks like this.
{
    "links": [
        {
            "rel": "self",
            "href": "https:\/\/ironforge.r2020.2a.suitetalk.api.netsuite.com\/services\/rest\/query\/v1\/suiteql?limit=1000&offset=0"
        }
    ],
    "count": 9,
    "hasMore": false,
    "items": [
        {
            "links": [],
            "accttype": "Income",
            "balance": "5943019.96",
            "periodname": "Apr 2020",
            "startdate": "4\/1\/2020"
        },
        {
            "links": [],
            "accttype": "Income",
            "balance": "2056645.07",
            "periodname": "May 2020",
            "startdate": "5\/1\/2020"
        },
        {
            "links": [],
            "accttype": "Income",
            "balance": "495079.36",
            "periodname": "Jun 2020",
            "startdate": "6\/1\/2020"
        },
        {
            "links": [],
            "accttype": "COGS",
            "balance": "-555563.38",
            "periodname": "Apr 2020",
            "startdate": "4\/1\/2020"
        },
        {
            "links": [],
            "accttype": "COGS",
            "balance": "-950209.65",
            "periodname": "May 2020",
            "startdate": "5\/1\/2020"
        },
        {
            "links": [],
            "accttype": "COGS",
            "balance": "-194624.69",
            "periodname": "Jun 2020",
            "startdate": "6\/1\/2020"
        },
        {
            "links": [],
            "accttype": "Expense",
            "balance": "-1747192.22",
            "periodname": "Apr 2020",
            "startdate": "4\/1\/2020"
        },
        {
            "links": [],
            "accttype": "Expense",
            "balance": "-1075306.14",
            "periodname": "May 2020",
            "startdate": "5\/1\/2020"
        },
        {
            "links": [],
            "accttype": "Expense",
            "balance": "-705734.64",
            "periodname": "Jun 2020",
            "startdate": "6\/1\/2020"
        }
    ],
    "offset": 0,
    "totalResults": 9
}
Notice that records are returned for each account type (Income, Cost of Goods Sold, and Expense) for the three periods that make up the specified date range (in this case, April 1st thru June 7th), and the records are returned in order by account type and period. This makes it very easy to generate tables and charts from the data.
The query shown returns summarized data only. However, it is also possible to summarized at lower levels, and fully simulate NetSuite's native Income Statements.
Comparative Income Statements - With a Twist
Last week, the firm's CFO asked if it would be possible to generate "period to date" Comparative Income Statements. In other words, reports that only include transactions up to a certain day of the month. This makes it possible to see how the company is doing based on where the financials were on the same day in the previous periods.
At first I thought that this was going to be difficult to do, but it was actually quite easy to do. Here's a revised version of the query that includes "period to date" support.
SELECT
	AccountingPeriod.PeriodName,
	AccountingPeriod.StartDate,
	Account.AcctType,
	SUM( COALESCE( TransactionAccountingLine.Credit, 0 ) - COALESCE( TransactionAccountingLine.Debit, 0 ) ) AS Balance
FROM
	Transaction
	INNER JOIN TransactionAccountingLine ON ( TransactionAccountingLine.Transaction = Transaction.ID )
	INNER JOIN Account ON ( Account.ID = TransactionAccountingLine.Account )
	INNER JOIN AccountingPeriod ON ( AccountingPeriod.ID = Transaction.PostingPeriod )
WHERE
	( Transaction.TranDate BETWEEN TO_DATE( '2020-04-01', 'YYYY-MM-DD' ) AND TO_DATE( '2020-06-07', 'YYYY-MM-DD' ) )
	AND ( Transaction.Posting = 'T' )
	AND ( EXTRACT( DAY FROM Transaction.TranDate ) <= 7 )
	AND ( Account.AcctType IN ( 'Income', 'COGS', 'Expense', 'OthIncome' ) )
GROUP BY
	AccountingPeriod.PeriodName,
	AccountingPeriod.StartDate,
	Account.AcctType
ORDER BY
	CASE
		WHEN Account.AcctType = 'Income' THEN 1
		WHEN Account.AcctType = 'OthIncome' THEN 2
		WHEN Account.AcctType = 'COGS' THEN 3
		WHEN Account.AcctType = 'Expense' THEN 4
		ELSE 9
		END ASC,
	AccountingPeriod.StartDate ASC
As you can see, I've simply added an additional filter condition:
AND ( EXTRACT( DAY FROM Transaction.TranDate ) <= 7 )This limits the transactions, regardless of what period they're in, to those that occurred on or before the 7th day of the month.
A Sneak Peek at NS Charts
I mentioned earlier that the portal also provides charts. The charts are being generated by NS Charts, a NetSuite charting service that I've been working on. The service, which is currently in beta, provides several standard charts, including sales summaries, gross and net income, cost of sales / cost of goods sold, expenses, and more. It also makes it possible for me to provide custom reports as customers request them.
The charts that NS Charts generates can be used in many different ways, such as in the portal that I described above. I also have a customer that is using the service to generate charts for use in a custom mobile app.
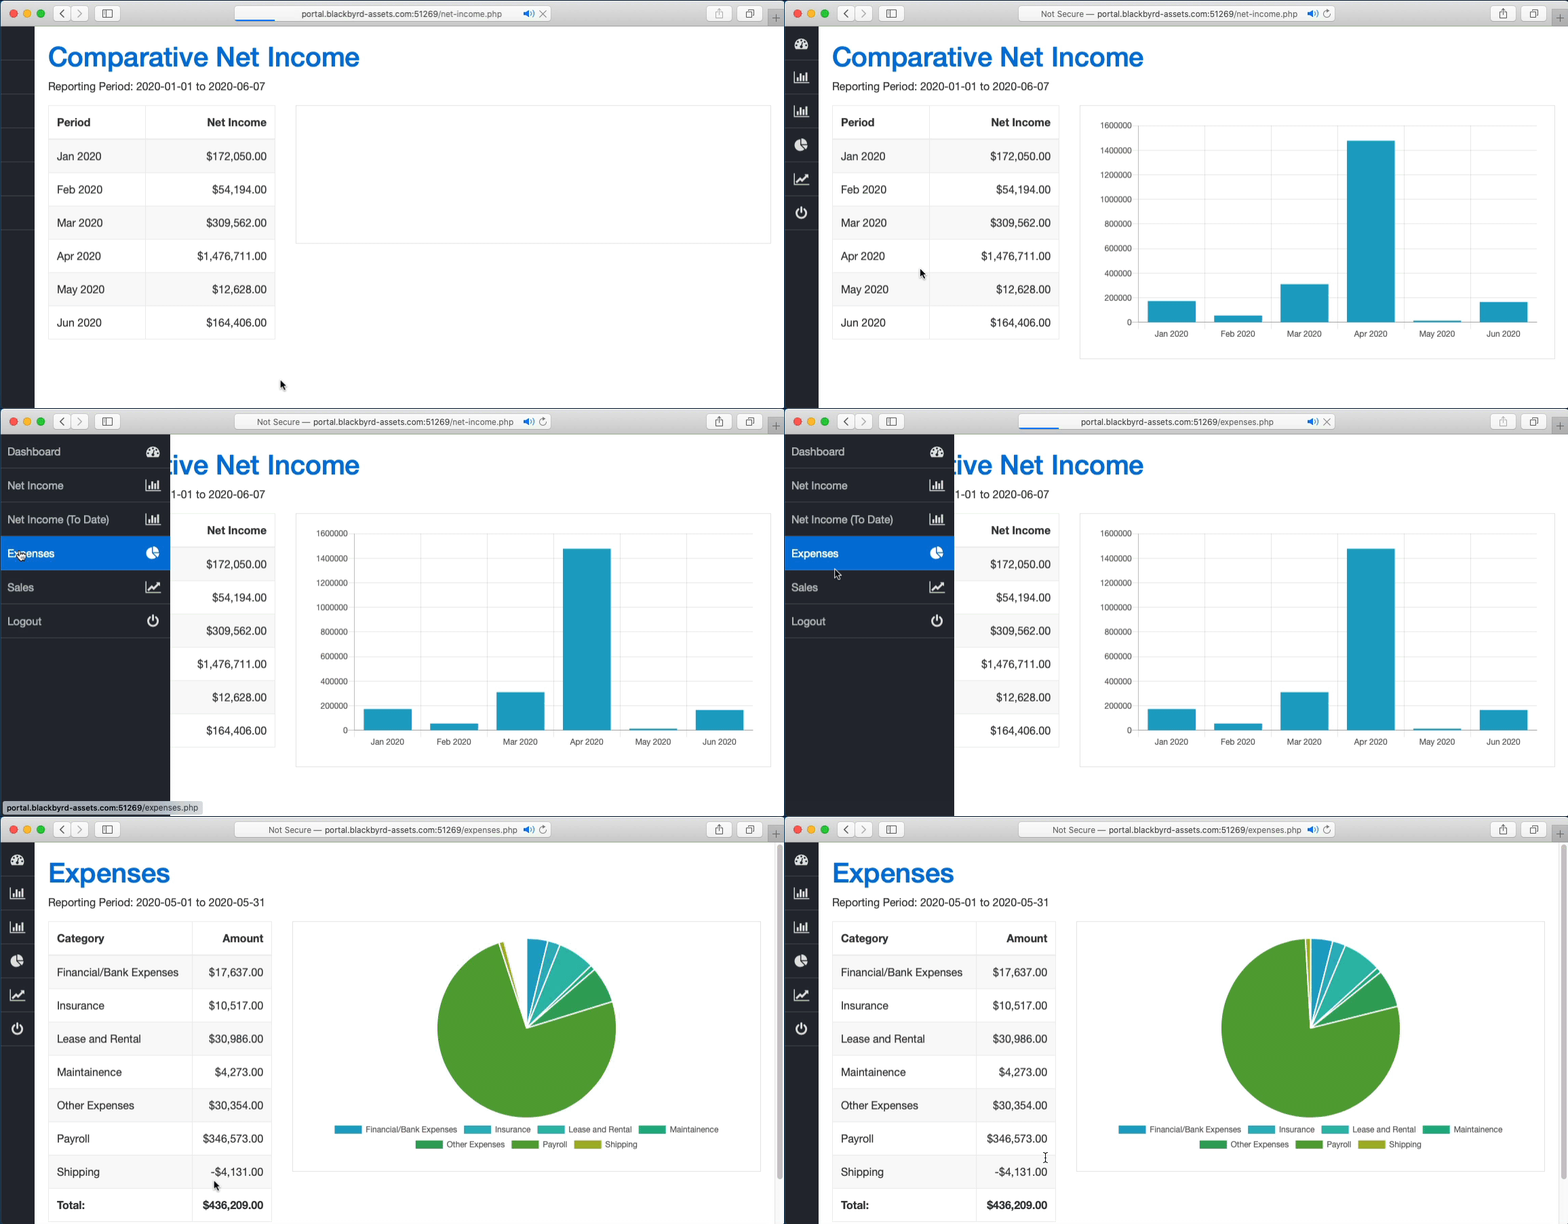
Here are a few of the charts as they appeared in an early version of the portal.
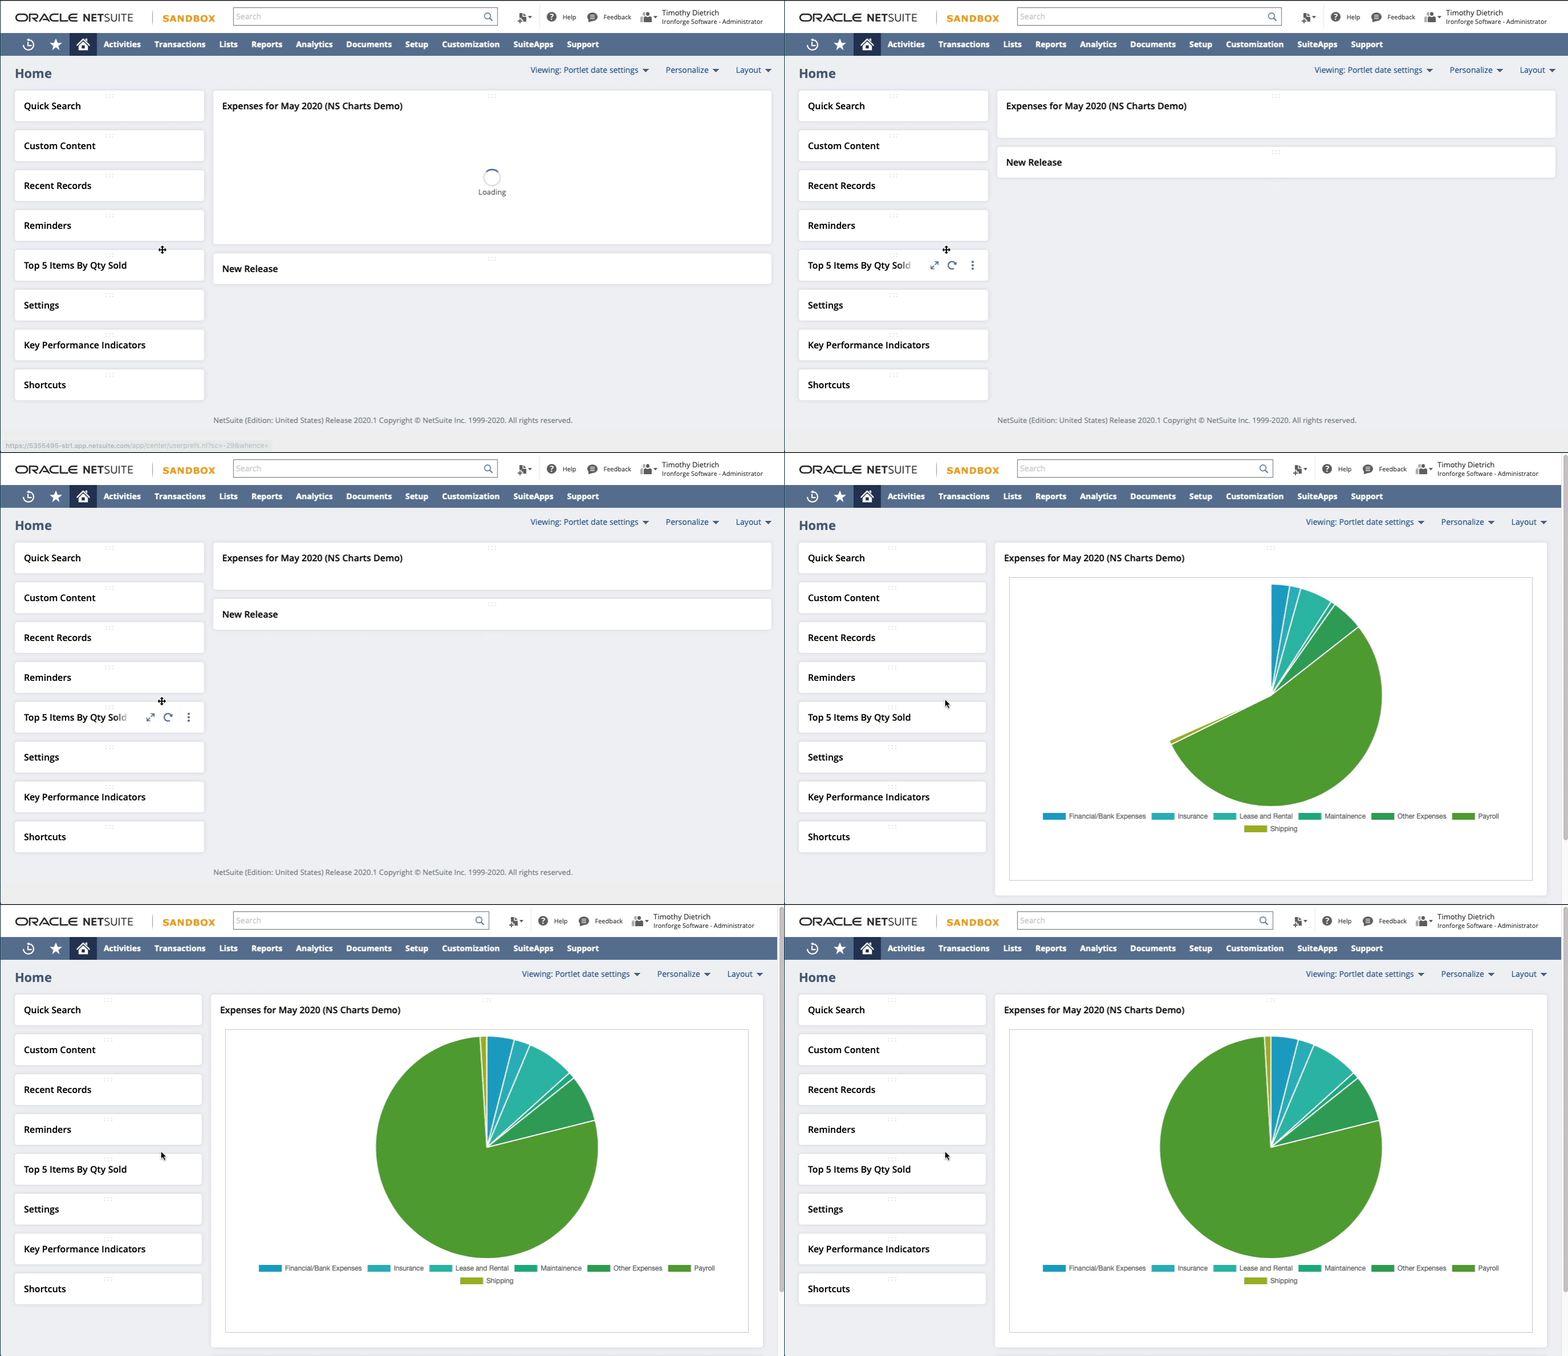
And of course, the charts can be used in NetSuite itself, as Dashboard portlets. Here's an example of a chart displayed on a NetSuite Dashboard via a portlet.
I'll be providing more information about NS Charts in the weeks ahead.

