Earlier this week, the NetSuite administrator at one of my larger OneWorld clients reached out to me with a request for a few SuiteQL queries. They needed to know the total number of employees, by subsidiary, that have been granted access to NetSuite.
In this post, I'll share the queries that I developed for my client. I'll also show how you can use the document generation function of the SuiteQL Query Tool to generate a pie chart based on the query results.
Employees with NetSuite Access
Let's start with a query that identifies the employees that have been given access to NetSuite. We can do that by filtering on the "GiveAccess" column in the Employee table.
SELECT
	LastName,
	FirstName,
	Title,
	BUILTIN.DF( Supervisor ) AS Supervisor,
	BUILTIN.DF( Subsidiary ) AS Subsidiary
FROM
	Employee
WHERE
	( GiveAccess = 'T' )
ORDER BY
	LastName,
	FirstName
The results of the query will look something like this.

Notice that I'm using the BUILTIN.DF function to get the name of each employee's supervisor and subsidiary, which helps me avoid the need to join from the Employee table to the Employee table itself, and to the Subsidiary table. For more information on the BUILTIN.DF function, see this post from July of 2020.
Total Number of Licenses Used
We can easily get the total number of licenses used by all subsidiaries with a simple query such as this.
SELECT
	COUNT(*) AS LicensesUsed
FROM
	Employee
WHERE
	( GiveAccess = 'T' )
Licenses Used by Each Subsidiary
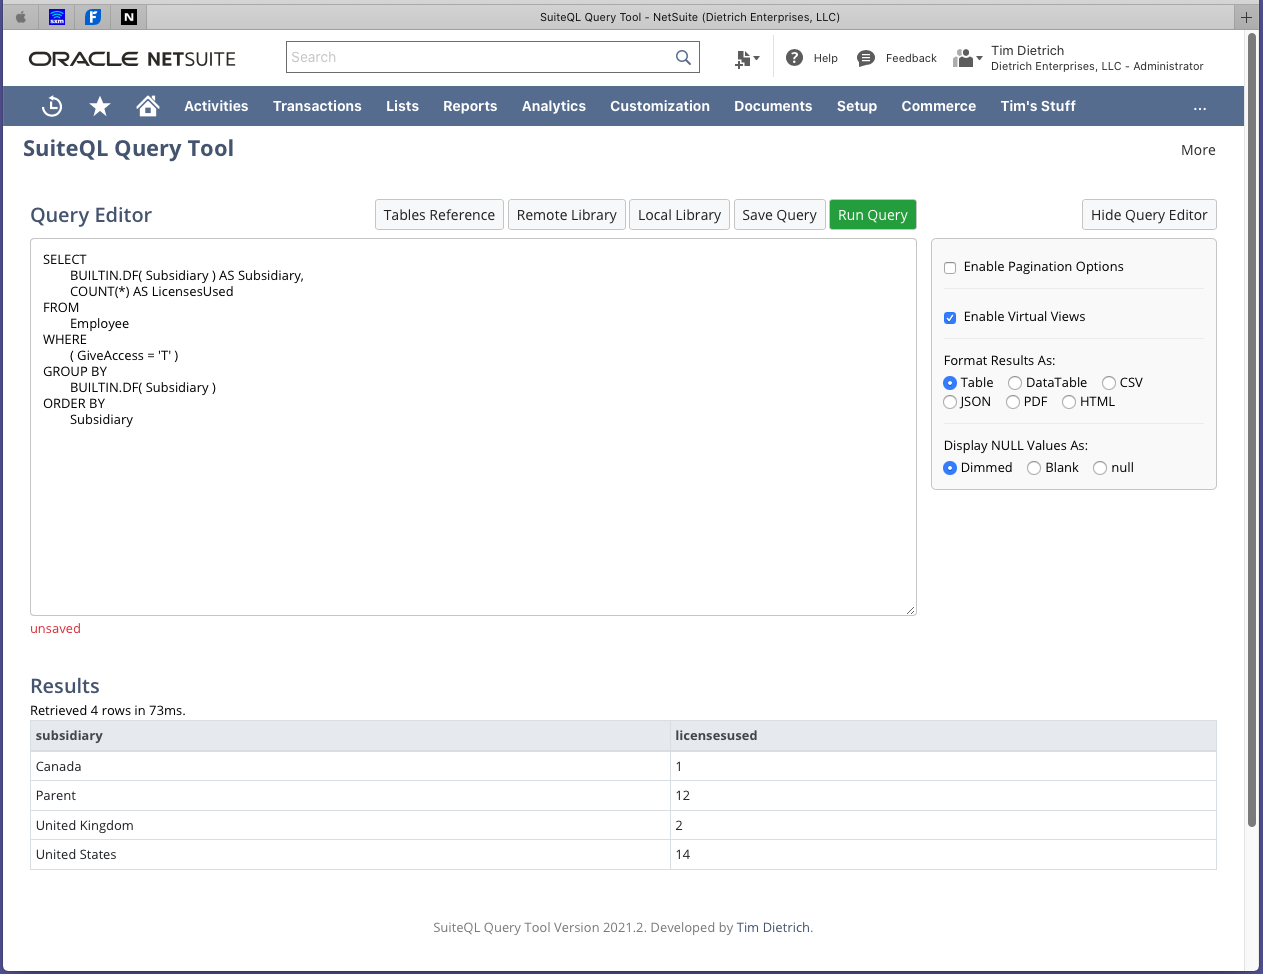
To get subtotals by subsidiary, I simply group the employees based on their subsidiary.
SELECT
	BUILTIN.DF( Subsidiary ) AS Subsidiary,
	COUNT(*) AS LicensesUsed
FROM
	Employee
WHERE
	( GiveAccess = 'T' )
GROUP BY
	BUILTIN.DF( Subsidiary )
ORDER BY
	Subsidiary
The results of the query will look like this.
Licenses Used by Each Subsidiary, with a Grand Total Summary Row
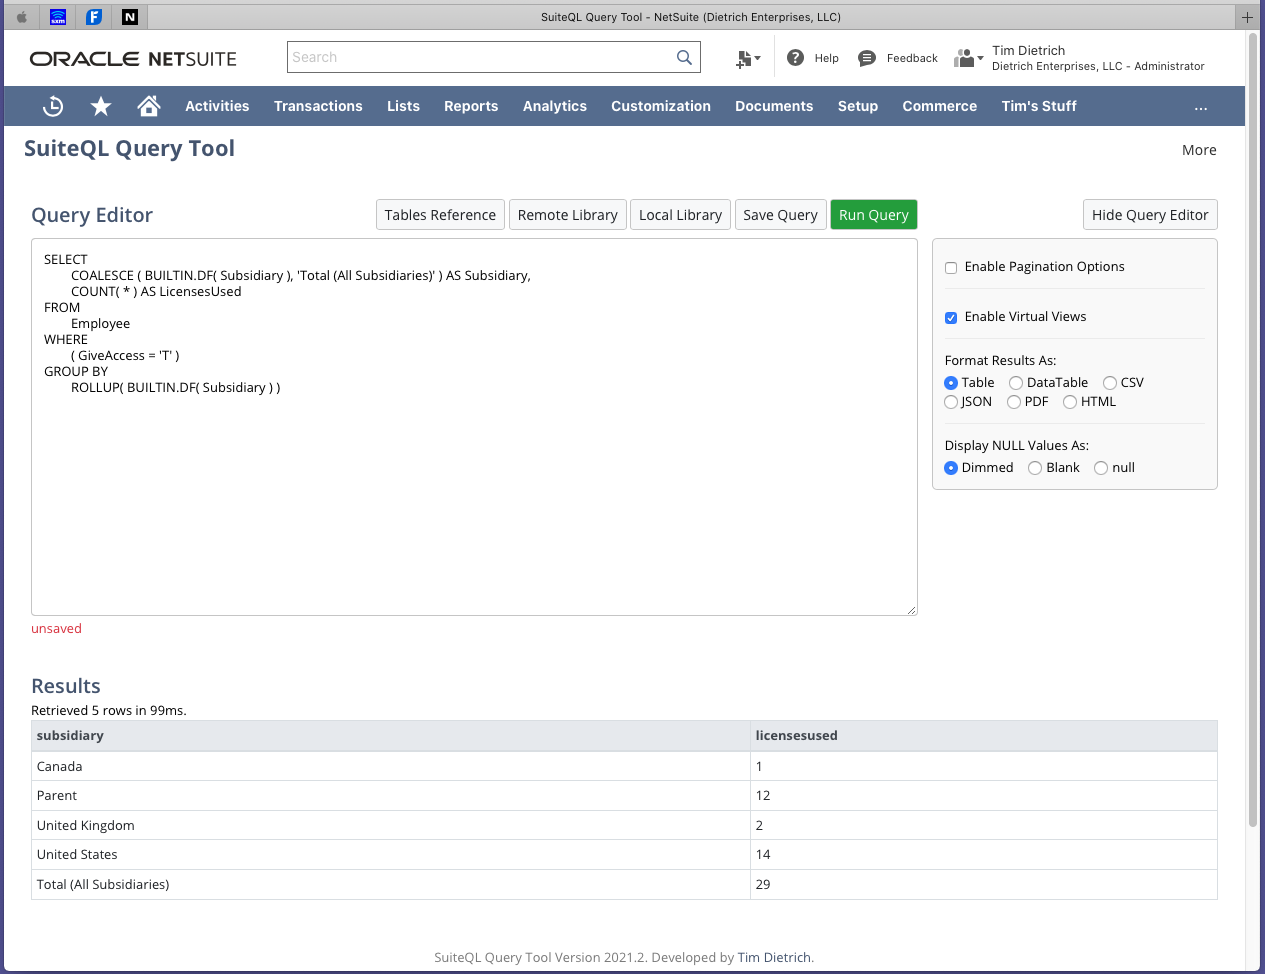
Suppose that in addition to the subsidiary subtotals, we also want a trailing grand total included in the results. In September, I wrote about how you can use the SQL ROLLUP extension to add summary rows to query results. Here's that same approach applied to the previous query.
SELECT
	COALESCE ( BUILTIN.DF( Subsidiary ), 'Total (All Subsidiaries)' ) AS Subsidiary,
	COUNT( * ) AS LicensesUsed
FROM
	Employee
WHERE
	( GiveAccess = 'T' )
GROUP BY
	ROLLUP( BUILTIN.DF( Subsidiary ) )
The results of the query will look like this. Notice the additional row at the bottom of the table.
Generate a Pie Chart Based on the Query Results
And finally, suppose that we want to generate a pie chart based on the results of the query. Using the SuiteQL Query Tool's document generation function, as well as the Chart.js open source JavaScript library, that's easy to do. (This is a technique that I first wrote about in this post.
First, I'll adjust the query so that it no longer includes the grand total summary line.
SELECT
	BUILTIN.DF( Subsidiary ) AS Subsidiary,
	COUNT(*) AS LicensesUsed
FROM
	Employee
WHERE
	( GiveAccess = 'T' )
GROUP BY
	BUILTIN.DF( Subsidiary )
ORDER BY
	Subsidiary
Next, I'll indicate that I want the results to be formatted as an HTML document, and provide a template that will take the results and generate the HTML document. (The template that I'm using is included at the bottom of this post.)
Here's a short animation that shows the process of generating the document.
Wrapping Up
This is the type of client request that I really enjoy working on. Using SuiteQL, I was able to help the client quickly, and give them queries that they can use on their own in the future.
Please let me know if you have any questions about the queries that I've shared in this post.
Here's the template that I used to generate the chart.
<?xml version="1.0"?>
<!DOCTYPE pdf PUBLIC "-//big.faceless.org//report" "report-1.1.dtd">
<html>
	<head>
		<title>License Usage by Subsidiary</title>
		<link rel="stylesheet" href="https://maxcdn.bootstrapcdn.com/bootstrap/4.5.2/css/bootstrap.min.css">
		<script src="https://cdn.jsdelivr.net/npm/chart.js@2.8.0"></script>
		<script src="https://cdn.jsdelivr.net/npm/chartjs-plugin-colorschemes"></script>
	</head>
	<body style="margin: 24px;" >
		<h2 style="margin-bottom: 24px; text-align: center;">NetSuite License Usage by Subsidiary</h2>

		<div style="padding: 3px;">
			<canvas id="theChart"></canvas>
			<script>
				var ctx = document.getElementById('theChart').getContext('2d');
				var chart = new Chart(ctx,
					{
						data: {
							labels: [<#list results.records as record>''<#if record?has_next>,</#if></#list>],
							datasets: [
								{
									label: 'Licenses Used',
									data: [<#list results.records as record><#if record?has_next>,</#if></#list>]
								}
							]
						} ,
						type: 'pie',
						options: {
							responsive: true,
							plugins: {
								legend: { position: 'top' },
								title: { display: true, text: 'NetSuite License Usage by Subsidiary' }
							}
						}
					}
				);
			</script>
		</div>

	</body>
</html>